Population Adjustment in Network Meta-analysis
In an ideal world, a single randomized controlled trial (RCT) would be used to compare and evaluate the individual treatment effects for all possible treatments of interest. Of course, this is often not feasible, in which case network meta-analysis (NMA) can be used to link RCTs with common treatment arms and compare treatments across different trials. For an introduction to NMA, see our previous blog.
One of the common challenges often faced in standard NMA is how to account for differences in the population compositions of all the different trials. When individual patient data (IPD) is available (for one or more study), then these can be used to adjust for imbalances in population structure and increase comparison reliability. These methods are known as “population adjustment” and are becoming increasingly more common in submissions to reimbursement agencies, such as the National Institute for Health and Care Excellence (NICE) [1].
Population adjustment methods can also be used when there are no studies available to link together all of the treatments of interest, or when one of the treatments has only been studied in a single-arm trial.
Key Takeaways
- Population adjustment methods correct for differences in patient characteristics between trials, ensuring more reliable treatment comparisons in network meta-analysis.
- Effect modifiers change the relative treatment effect and must be adjusted for, while prognostic variables affect outcomes but not the relative effect.
- Anchored comparisons (with a common comparator) typically require adjustment only for effect modifiers, whereas unanchored comparisons must adjust for both prognostic variables and effect modifiers.
- Matching-Adjusted Indirect Comparison (MAIC) and Simulated Treatment Comparison (STC) are key approaches that use IPD and aggregate data to “map” treatment effects from one population to another.
Single-arm trials are becoming increasingly common with 44% of recent EMA oncology approvals, and >50% of FDA accelerated approvals being based on them [2]. In either case, population adjustment methods are used to create a “synthetic” trial that enables direct comparisons between unlinked treatments.
In this blog we will provide an introduction to population adjustment methods. We will describe the difference between effect modifiers and prognostic variables, briefly outline the methods described in the NICE Decision Support Unit (DSU) Technical Support Document (TSD) 18 [1] for population adjustment, and explore some of the assumptions behind these methods.
What needs adjusting? Effect Modifier vs. Prognostic Variable
In a standard network meta-analysis, a key assumption is that the trials compared do not differ in any characteristics that impact the relative treatment effects. These characteristics are called ‘effect modifiers’. In contrast, characteristics that directly affect the outcome, but not the relative treatment effect on the outcome, are called ‘prognostic variables’ [1]. A standard NMA can handle differences among prognostic variables. However, differences in effect modifiers must be accounted for through the use of population adjustment methods.
- Effect modifiers refer to characteristics that impact the relative treatment effect
- Prognostic variables refer to characteristics that directly affect the outcome, but not the relative treatment effect on the outcome.
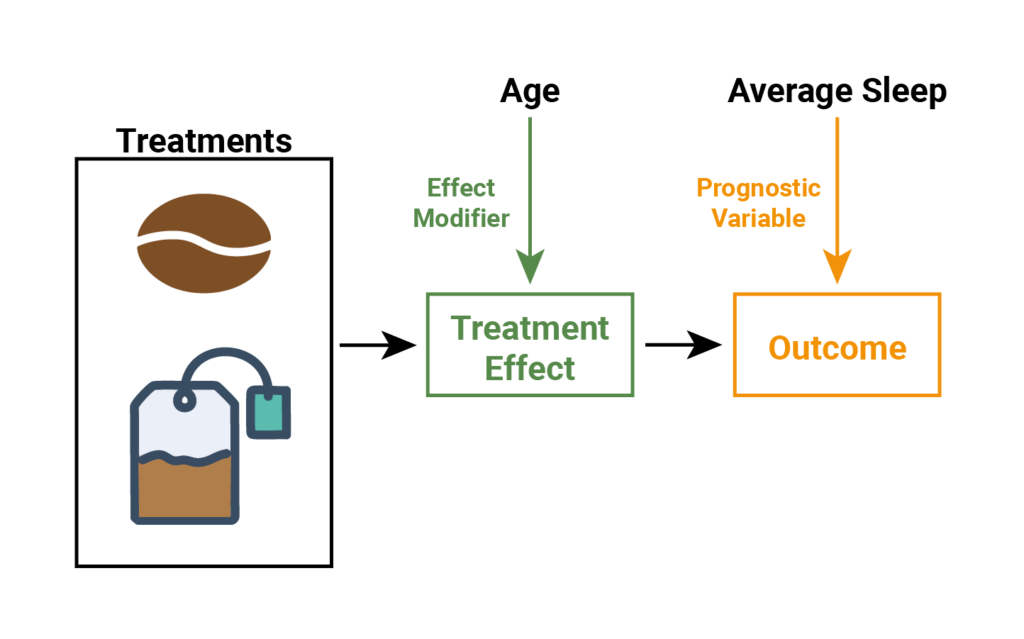
Let’s look at an example to help with our understanding. Take the hypothetical example used in our blog key assumptions of network meta-analysis, where we have a trial comparing two treatments for tiredness – tea and coffee. Figure 1 illustrates how two characteristics, average sleep and age, might affect tiredness. Here, average sleep directly affect how tired a person is, without impacting the effect of tea or coffee on tiredness (i.e., average sleep directly affects the outcome). Age however modulates the effect of tea and coffee (the treatment effect), which subsequently impacts how tired a person is. So we would say that average sleep is a prognostic variable and age is an effect modifier. But how can we be sure whether or not these characteristics impact the treatment effect?
Figure 1. The effect of age and average sleep on the treatment effect and/or outcome, for people drinking tea and coffee.
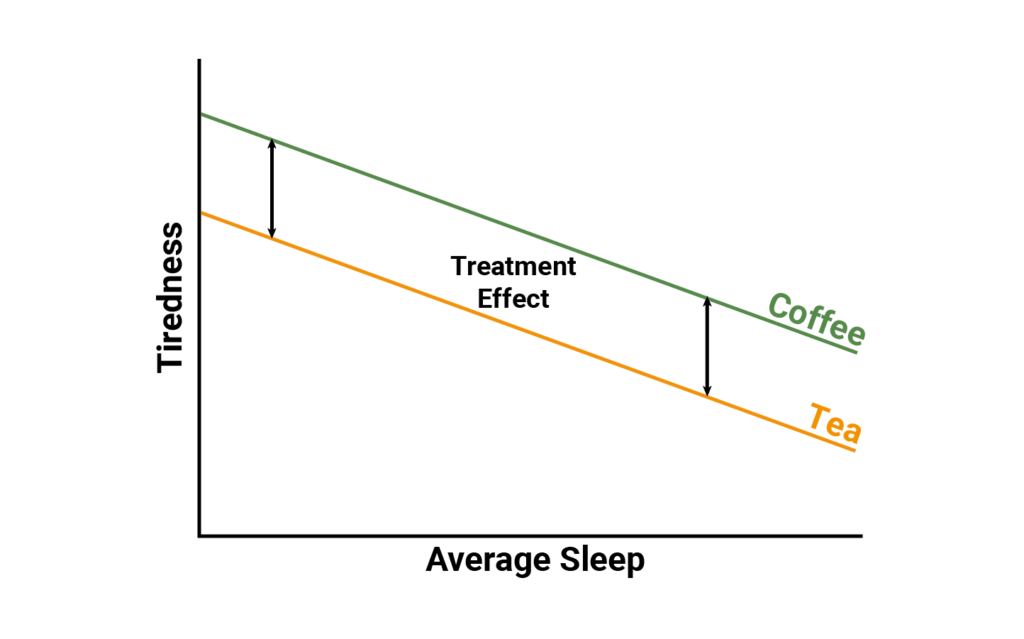
We can look at the relationship between the treatments (tea and coffee), the outcome (tiredness), and the patient characteristics (average sleep and age). Figure 2, (below), demonstrates that average sleep reduces tiredness amongst individuals who drink either tea or coffee. Further, the relationship between average sleep and tiredness is the same for both coffee and tea; therefore, the relative treatment effect is constant (i.e., a constant distance between tea and coffee).
Figure 2. prognostic variable
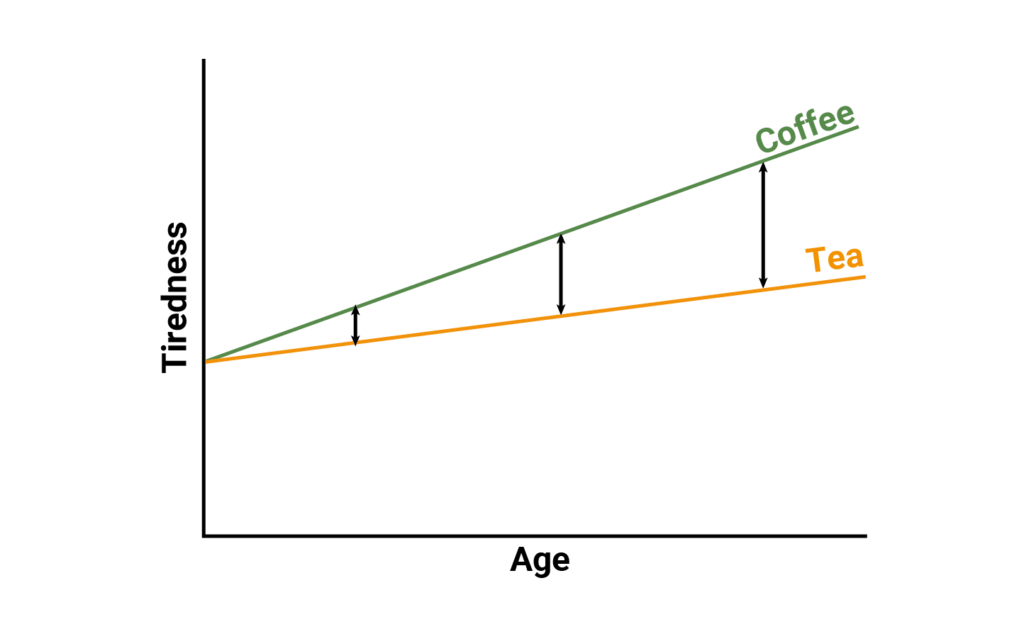
In Figure 3 (below), as age increases, tiredness increases amongst individuals drinking either tea or coffee. However, in this case the relationship between age and tiredness depends on if an individual drinks tea or drinks coffee. Consequently, the relative effect between tea and coffee depends on the age of the patient as can be seen by the varying distance between tea and coffee. So in this case, average sleep represents a prognostic variable as it predicts the outcome but does not impact the relative treatment effect, while age represents an effect modifier as it influences the treatment effect on the outcome.
Figure 3. effect modifier
Types of Population Adjustment
When using population adjustment methods, the need to adjust only for effect modifiers or both effect modifiers and prognostic variables, depends on the type of indirect comparisons being considered. That is, if the indirect comparisons are ‘anchored’ or ‘unanchored’.
In a standard NMA all treatments are joined together in a fully connected network, and any indirect comparisons are considered to be ‘anchored’. Such a network is illustrated in Figure 4 (left network) where coffee and tea are compared indirectly through a common comparator, decaf coffee. In this scenario, the goal of population adjustment is to mitigate the effect of population differences on treatment comparisons. As differences in any prognostic variables were already accounted for by randomization in the individual studies, only differences among effect modifiers need to be adjusted for [3].
On the other hand when a network is disconnected, the indirect comparisons are referred to as ‘unanchored’. Figure 4 (right network) illustrates an example in which coffee and tea are compared without a common comparator. In this case, the goal of population adjustment is to create a synthetic trial that can be used to link these two treatments together. Here it is assumed that the effects of all prognostic and effect modifiers can be accounted for through population adjustment using the reported data from the studies [3]. This is a very strong assumption, and therefore unanchored methods should only be used when anchored methods are not possible.
Figure 4. Network diagram of (left) connected network (anchored indirect comparison) and (right) disconnected network (unanchored indirect comparison).

When implementing population adjustment methods, The NICE DSU TSD 18 [3] describes two methods in detail – Matching-Adjusted Indirect Comparison (MAIC) and Simulated Treatment Comparison (STC). Both of these methods are used to “map the treatment effects observed in one population into the effects that would be observed in another population” [3], through the use of individual patient data from one population and aggregate data (i.e. summary statistics) from another. Either method can be used in the case of anchored or unanchored indirect comparisons, but will differ in their statistical approach. MAIC is a form of propensity score weighting and STC is a form of outcome regression.
If you are interested in learning more about the MAIC and STC, we will explore these methods in greater detail in our next two blogs.
References
- Phillippo, D.M. et al. (2018). Methods for Population-Adjusted Indirect comparisons in Health Technology Appraisal, Med Decis Making, 38(2): 200–211. doi:10.1177/0272989X17725740
- Phillippo, D.M. et al. (2016). NICE DSU Technical Support Document 18. Methods for Population-Adjusted Indirect Comparisons in Submission to NICE, Sheffield, NICE Decision Support Unit.