From Equivalence to Alarm: Bioassay Limits Explained
Bioassays are typically used to measure the properties of a manufactured product to ensure that it is of sufficient quality for use by patients. Inherent in this process is the need to make decisions based on the collected data. Is the potency of the product as expected? Are there any indications of the assay misbehaving? Has the assay demonstrated sufficient performance to pass validation? Seeing as it would be unacceptable to make these calls on vibes alone, we must put strict limits in place on various quantities throughout the bioassay lifecycle to determine actions after results are obtained.
This, however, leads to a plethora of limits, each with a slightly different definition and used at a different stage of the bioassay lifecycle. Here, we’re going to outline these differences and provide a cheat sheet to help ensure you know what limits to apply when.
Key Takeaways
- Different statistical limits support different decisions across the bioassay lifecycle, from confidence limits that quantify uncertainty, to equivalence limits that demonstrate assay suitability, to specification limits that protect product quality and safety.
- Validation acceptance limits ensure an assay’s accuracy and precision are sufficient for routine use, while alarm and alert limits based on historical data help track ongoing performance and detect signs of drift or failure.
- Using each limit type appropriately enables robust, defensible decision-making that safeguards product integrity and maintains assay reliability over time.
Confidence Limits
Far from a bioassay-exclusive concept, the confidence limit is a core statistical idea. So core, in fact, that we’ve covered it in detail in a series of three blogs! Nevertheless, it’s vital enough that we’ll give the spark notes version here.
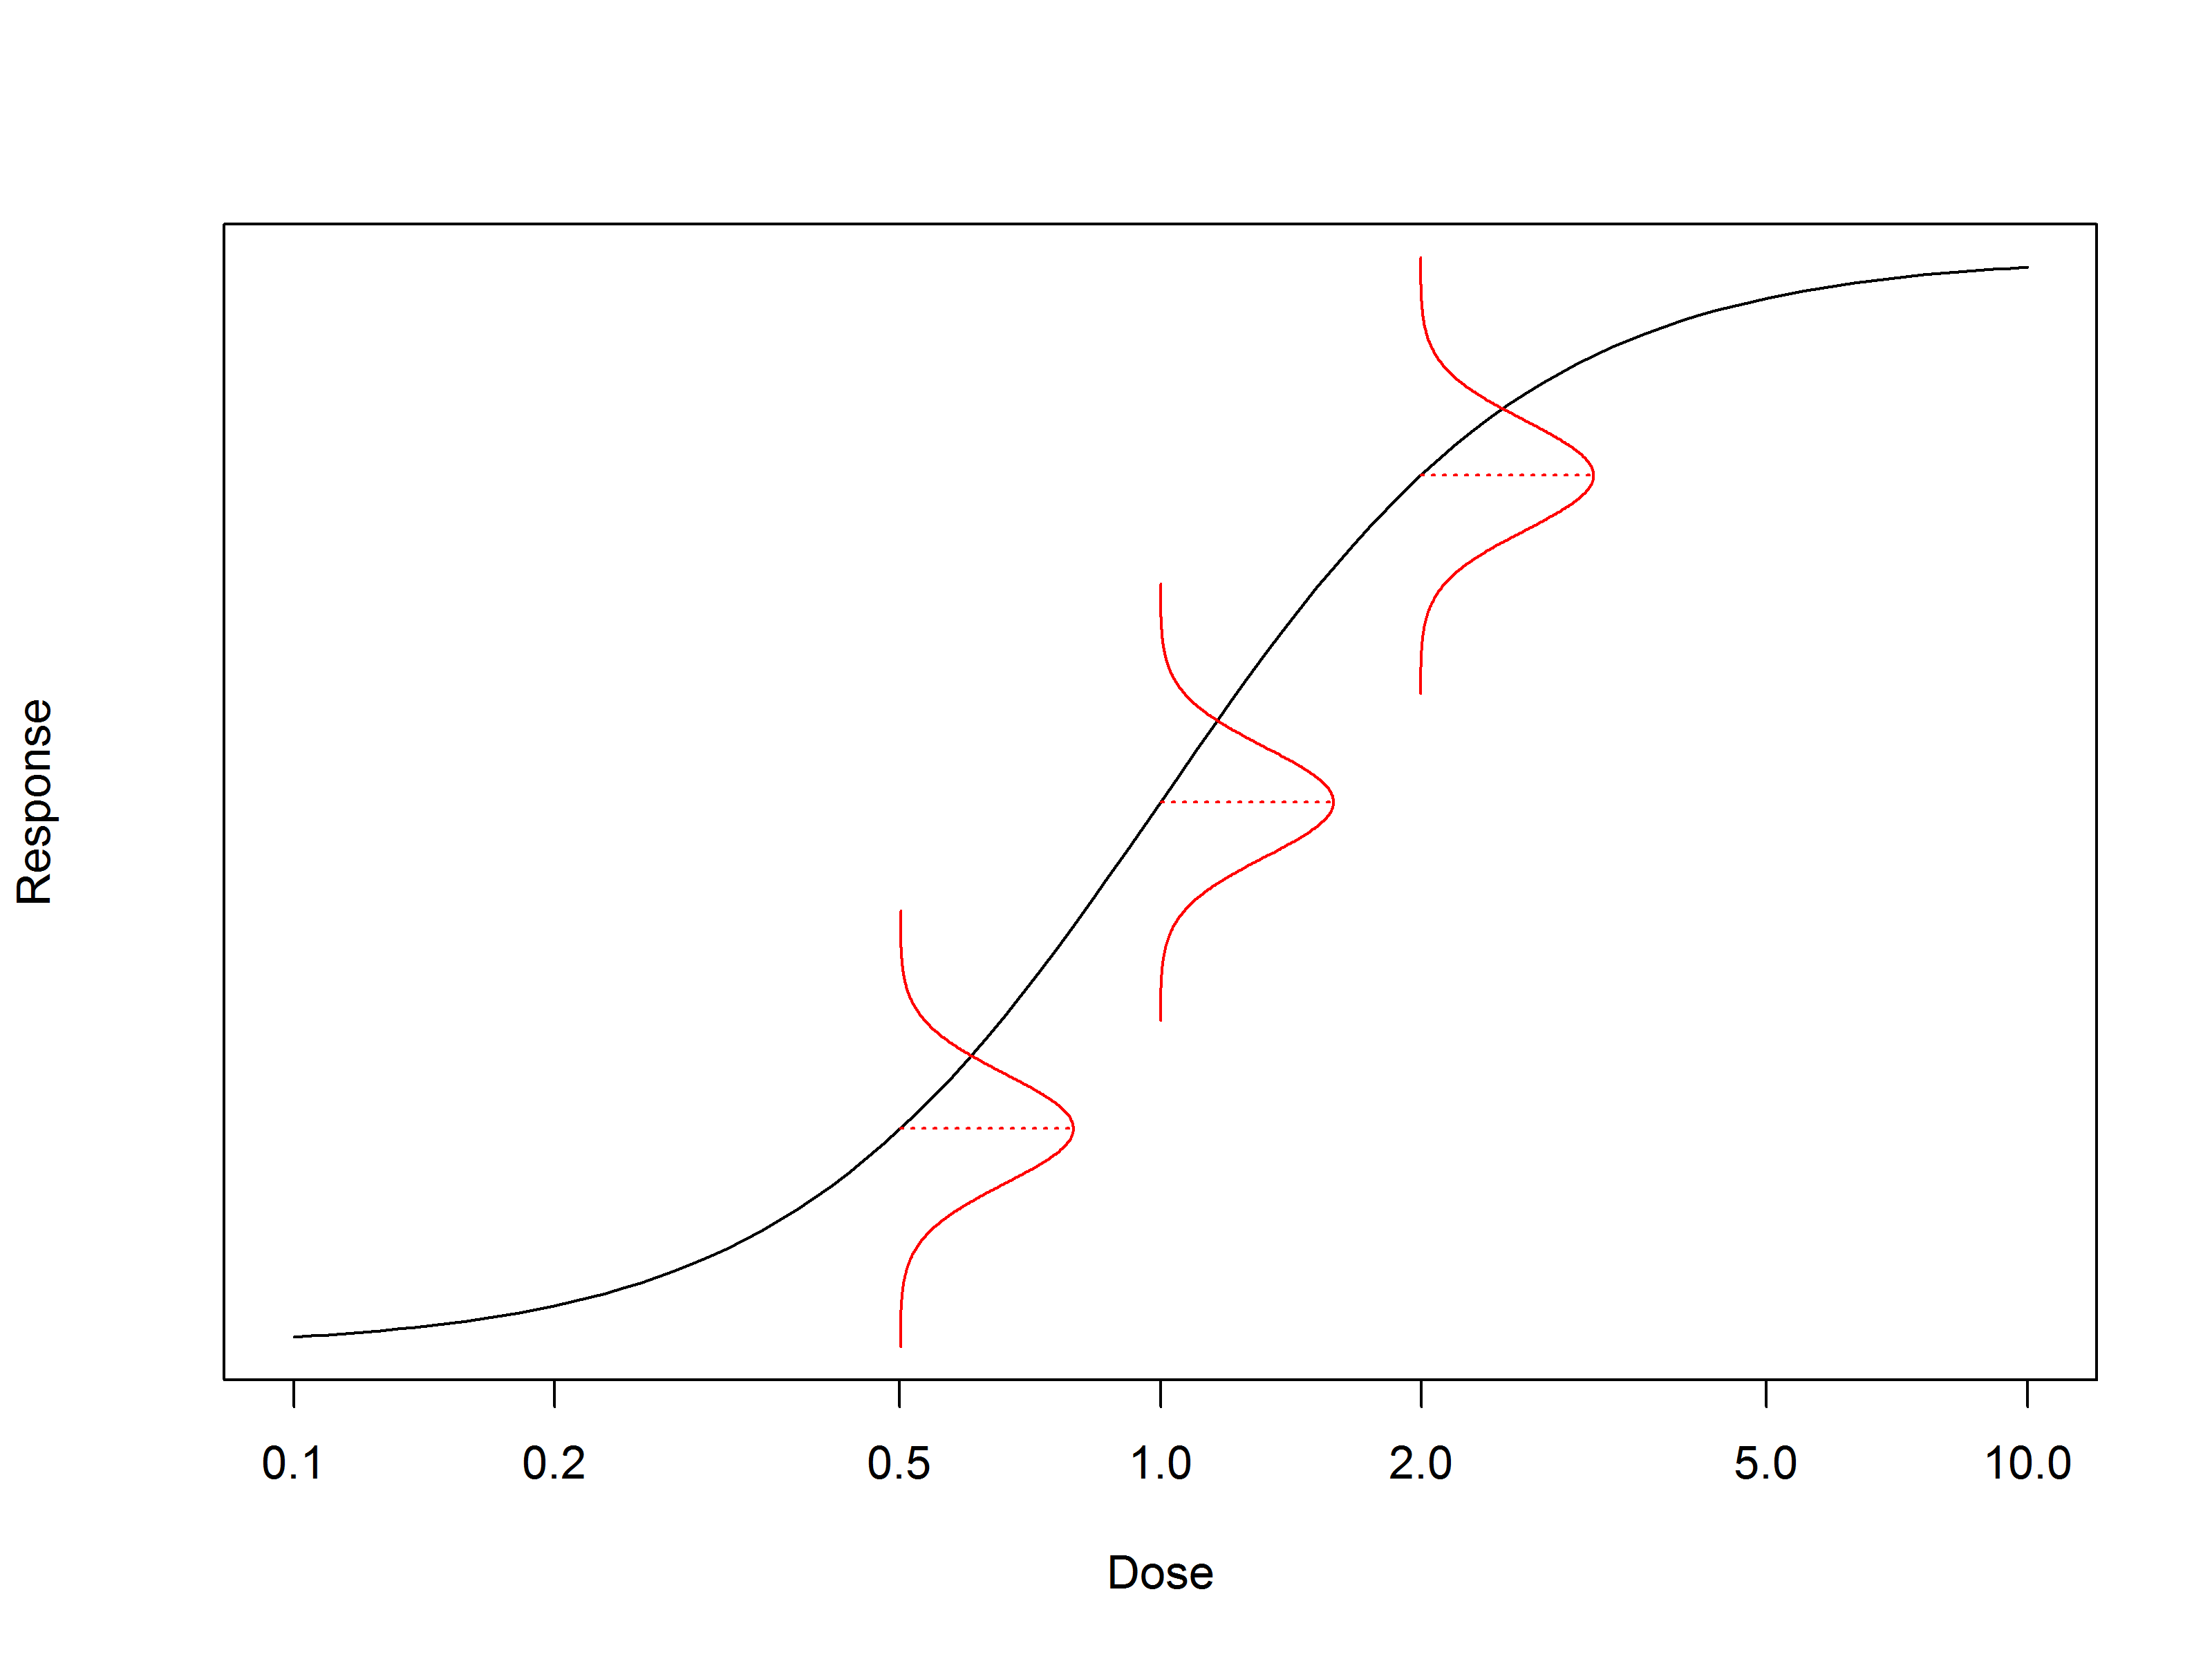
When we make a measurement, we usually consider the result to be a point measurement: a relative potency, an EC50, or similar. This point measurement is an estimate of the “true” value of the quantity in which we’re interested. There will always be some uncertainty associated with the experiment, meaning we can never say that the point measurement is anything more than an estimate.
A confidence interval gives us a way to understand the uncertainty associated with the measurement of the “true” value. We can consider it as a plausible range of values for the quantity we’re measuring. For example, if we repeated an EC50 measurement of a sample 100 times and took a 95% confidence interval each time, we would expect the “true” EC50 of the sample to be contained by 95 of the calculated intervals.
The upper and lower bounds of a confidence interval – the confidence limits – are often compared against other commonly-used limits to make decisions about the assay.
We won’t go into the mathematical details of calculating confidence intervals here – we’ve covered it before. In short, the value of the limits depend on the variability of the measurement on which they are based, the sample size, and the desired confidence level.
Equivalence limits
Equivalence testing is an alternative framework for statistical inference to the commonly-used significance (or difference) testing. It’s regularly used at a wide range of decision points for bioassays, including suitability testing, reference bridging and qualification, and assay transfer procedures.
An example of a suitability test where an equivalence approach might be used is testing for parallelism. Imagine we wanted to compare the slope parameter of two curves: they ought to be identical for the curves to be considered parallel. A difference test would assume that the parameters are the same and then look for evidence that they are different. A p-value below the significance level for a difference test indicates that there is evidence that the two parameters are different, and that the two curves are not parallel.
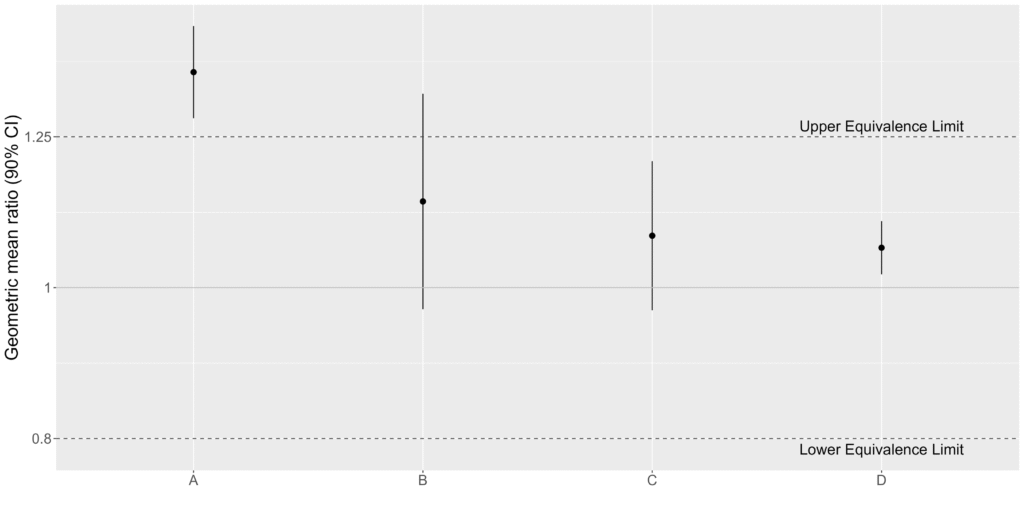
Equivalence testing takes an alternative approach. In an equivalence test, you assume that the parameters are different, and then look for evidence that they are actually the same. To show the parameters are equivalent, a region is defined where the difference between the parameters is considered negligible. This region is bounded by equivalence limits. If the confidence interval for the difference falls entirely within the equivalence limits, then the two parameters are considered equivalent. That is, we have equivalence if:
Upper Equivalence Limit (UEL) > UCL and LCL > Lower Equivalence Limit (LEL)
If these criteria are met, then we have evidence that the parameters are equivalent, and that the curves are parallel. If the confidence interval falls outside the equivalence limits on either end, then we have no evidence of equivalence.
Specification Limits
A validated assay is often used for batch-release testing of a manufactured product. Such a product will have a series of critical quality attributes (CQAs) which must remain within specific ranges in order for the product to remain safe and effective. These specification limits are informed by preclinical and clinical information about the drug product. Example specification limits might be that the relative potency must fall within 80%–125% of the expected relative potency for the batch.
Relative potency is a CQA for many biologic drug products, such as vaccines or those used in cell and gene therapies. That means that a specification limit is set for the relative potency. If the relative potency is found to fall outside of the specification limits when a batch of product is tested, then we have evidence that that batch of product is flawed and should be rejected.
An important part of assay validation is determining the probability of the assay result falling outside the specification limits, known as the probability of out-of-spec (Prob(OOS)). Prob(OOS) depends on both the accuracy and the precision of the assay. The acceptance criteria for a validation study should be determined in part with a view to ensuring Prob(OOS) is not too high. A high Prob(OOS) leads to many batches which are rejected purely by chance, which unnecessarily wastes resources.
Validation Acceptance Limits
Validation is a key stage in the bioassay development process. It marks the transition of an assay from development to routine use. For an assay to pass validation, it must demonstrate that it can provide sufficient accuracy and precision.
The accuracy of an assay is assessed using relative bias. This is related to the ratio between the value measured by the assay and the expected value over a series of measurements. For example, imagine we conducted a series of measurements comparing a reference standard to itself. We would expect the relative potency to be 100%. If, instead, the mean relative potency was 90%, then the assay has a relative bias of -10%. Similarly, if the mean relative potency was 110%, then the relative bias would be +10%.
The assay is considered to be sufficiently accurate if a confidence interval for the relative bias falls entirely within pre-defined acceptance limits for the relative bias. The acceptance limits are chosen based on the performance requirements of the assay, alongside pre-validation or qualification data.
Similarly, the precision of the assay is quantified using its intermediate precision, which can be measured as a geometric coefficient of variation. The intermediate precision enumerates the variability of the assay under normal conditions for a single laboratory. That means that both within-assay variability and between-assay variability is included. Just as with the relative bias, the intermediate precision is acceptable if its confidence interval falls within an acceptance limit. In this case, however, acceptance is bounded only on the upper end: an assay cannot be too precise, so we only care that the intermediate precision falls below the acceptance limit.
Alarm and Alert Limits
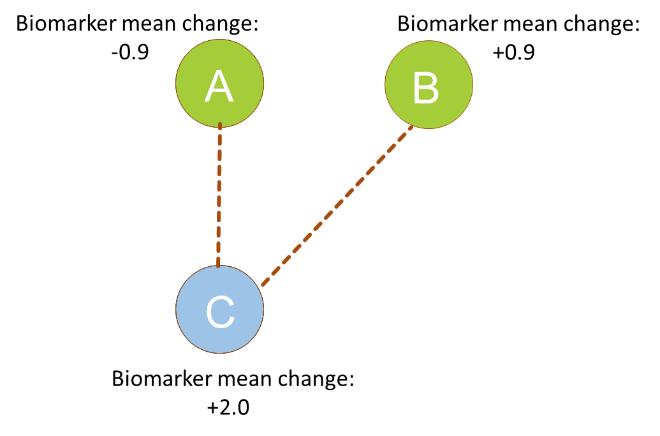
Specification limits test that a batch of manufactured product remains safe and effective. It is also important, however, to ensure that the assay system itself remains reliable. Bioassays are complex biological systems involving numerous reagents and often living cells, so it is vital to monitor assay results for signs of things beginning to go wrong. An example of this might be a drift in the potency of a reference standard – reference stock might degrade over time, meaning the reference becomes less potent, affecting the results of the assay.
Statistical process control (SPC) is often used to monitor for signs that an assay is moving out of control. SPC for bioassay usually plots one or more of the parameters of the models fit to the bioassay data against an index. A set of rules is then applied to the collected data. If the additional data means these rules are contravened, then an investigation takes place.
A commonly adopted rule involves alert and alarm limits. These are determined using historical data collected from the assay and put in place before monitoring begins. Often, the alert limits are two standard deviations either side of the mean of the historical data, with the alarm limits three standard deviations from the mean.
We can usually assume that the data we’re monitoring follows a normal distribution centred on the mean. Unless there’s a change in the assay, therefore, we expect the vast majority of collected data to fall close to the mean – more than 95% within two standard deviations. If we observe data which falls outside the alarm limits – outside three standard deviations – then this could be a sign that something in the assay process has changed. Similarly, several points outside the alert limits could be a sign that the assay is moving out of control, which warrants an investigation.
Note that the relative potency of the test sample is usually not an appropriate parameter to monitor using SPC. Test sample relative potency only tells us about the properties only of the sample we’re testing. For example, a test sample relative potency which falls well outside of its normal range does not necessarily indicate that the assay is moving out of control. Instead, it is more likely to result from an issue with that sample – perhaps a manufacturing error. That’s why it’s important to have both specification limits – which assess the test sample – and SPC – which assesses ongoing performance of the assay – in place for a routine assay.
Understanding the different types of limits used throughout the bioassay lifecycle is critical to making informed, data-driven decisions. We calculate confidence intervals to quantify experimental uncertainty and apply equivalence limits during suitability testing, and establish acceptance limits to validate assay performance. Further, we use specification limits to safeguard product quality, as well as alarm and alert limits to help monitor the assay system’s health over time. By appreciating the role and application of each type of limit, we can turn what could be a confusing landscape of thresholds into a structured and defensible quality strategy.