ELISA Analysis: The Bursa-Yellowlees Method
Interpolation analysis is used to find the concentration of a substance in a sample. For biologics, this is often used in ELISA and other bioanalytic analyses. This blog introduces interpolation analysis for ELISA and presents a new method developed by Quantics. The Bursa-Yellowlees Method uses the available ELISA data more effectively and greatly simplifies the test suitability criteria. In general, the method requires fewer samples to achieve the same precision of result. The Bursa-Yellowlees Method is especially useful in situations where samples are expensive, in short supply, or when high throughput is required.
The latest release of QuBAS, the bioassay software from Quantics, uses the Bursa-Yellowlees Method for interpolation analysis of ELISA-type assays.
The traditional method for ELISA analysis
Key Takeaways
- The Bursa-Yellowlees Method improves traditional ELISA interpolation by making more efficient use of available data, potentially reducing the number of required sample dilutions and eliminating complex suitability criteria.
- Unlike the standard ELISA approach, which often requires re-testing due to sample limitations, this method allows for more data points to contribute to final results, minimising waste and reducing the need for additional testing.
- The method introduces a streamlined approach to determining test validity, relying only on goodness-of-fit testing and confidence intervals rather than rigid absolute reference values. This ensures more accurate and reliable ELISA analysis, particularly in high-throughput settings.
The underlying fundamental assumption is that the dose-response curves of the test and reference are the same.
The standard approach has 4 steps:
Step 1
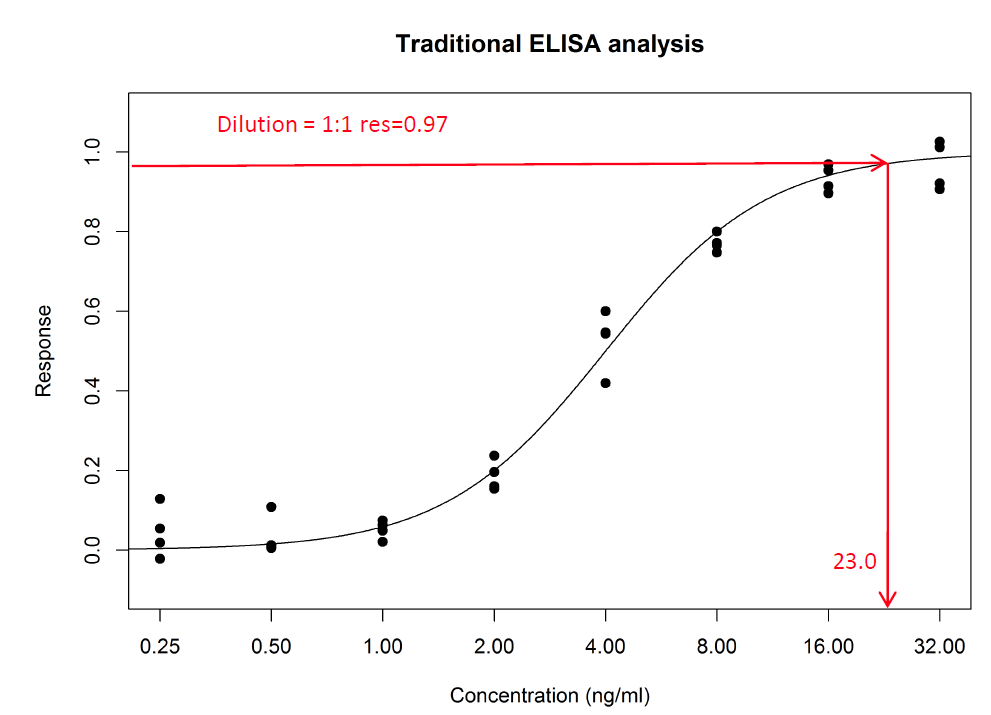
Plot and model the standard (reference) curve. Typically a linear or 4pl model is fitted though others may be used. (See this blog about fitting dose-response curves for more information).
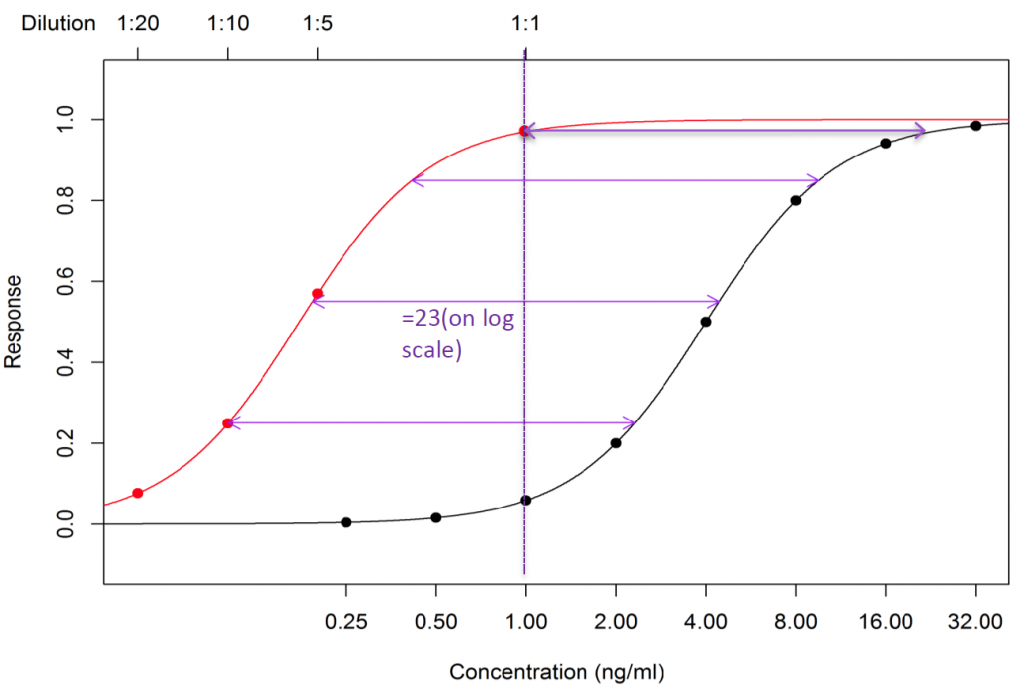
In this example, 8 doses are used each with 4 replicates.

Step 2
Plot the unknown points and interpolate from the reference curve to get the unknown concentration.
In this example the dilution of the sample is 1:1, and the response is 0.97. The interpolated reference concentration for a response of 0.97 is 23 ng/ml (see figure). So the concentration of the sample is also 23 ng/ml.
Step 3
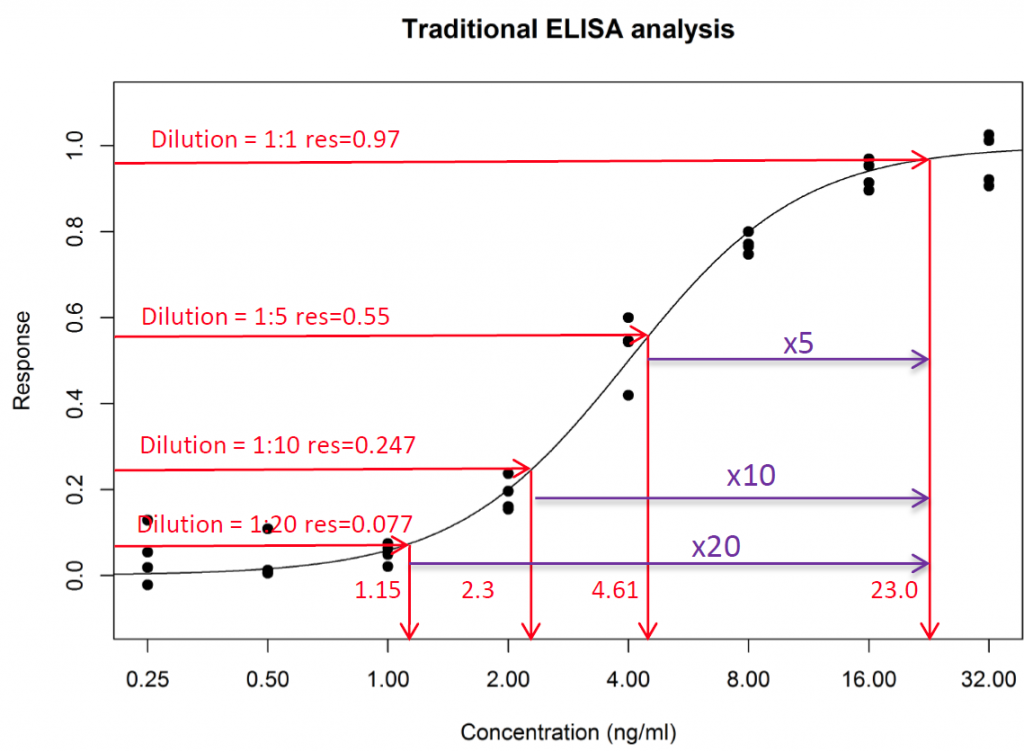
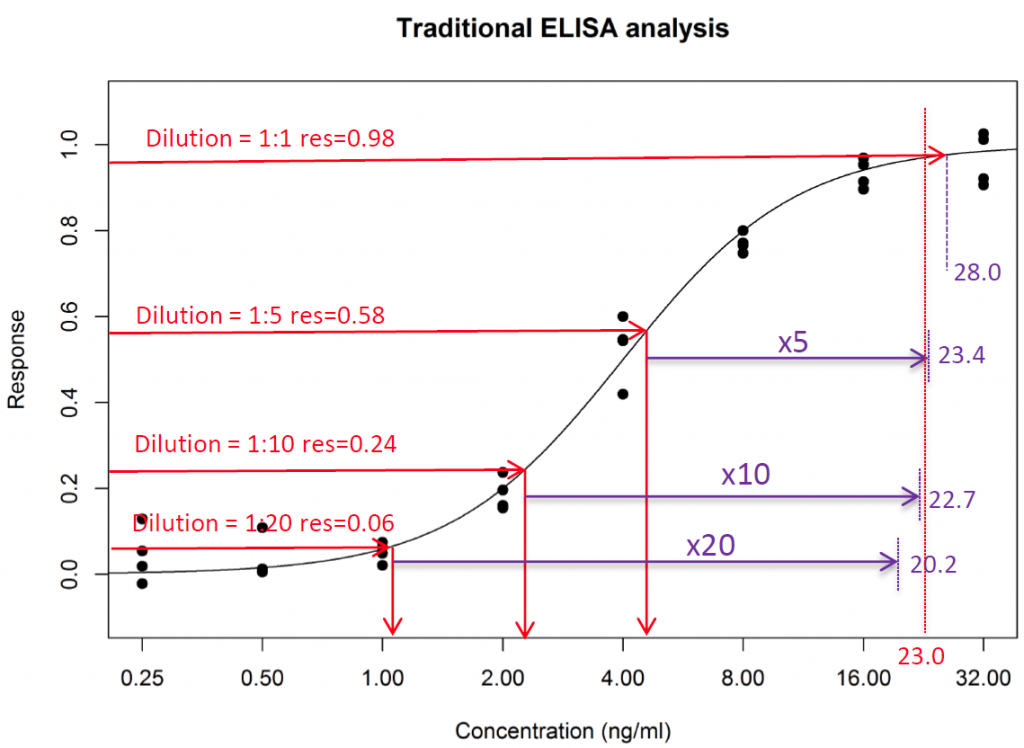
Often, other dilutions are tested as well, partly to make sure that there is at least one within the range of the standard, and partly to increase precision. The concentration result obtained is then adjusted for the dilution factor.
If all the dilutions are perfect, there is no variability and the sample has exactly the same dose response relationship as the standard, then all these dilutions will give the same result.
Step 4
In practice, there is some variability and a geomean of the results is taken. The geomean is selected because the concentration values are log-normally distributed.
Geomean = 23.4
Note: Arithmetic Mean = 23.6. Many labs use the artithmetic mean. This will create a small positive bias to the reported values as the geomean is always less than than the artithmetic mean.
Problems with the traditional approach for ELISA analysis
This standard approach gives equal weight to all points. Points outside the asymptotes have to be excluded because no result can be obtained, and it is usual to exclude points that are interpolated from areas of the standard near the asymptotes. It is also common to exclude points with replicates if the variability within the replicate group is large.
This leads to complex suitability criteria that depend on the absolute values of the curve fit of the standard. In some situations, re-testing is required using a different dilution series.
In situations where the sample is in very short supply, or very expensive or both, this can be a major problem.
The result is usually reported without confidence intervals. However, it is often instructive to calculate these. Many clients are shocked by the poor precision of results that their sample suitability criteria “pass”.
The Bursa – Yellowlees Method
As noted above, the fundamental assumption of interpolation analysis is that the test sample behaves as a dilution of the standard, i.e. the dose response relationships are identical and could be plotted on top of each other.
The Bursa-Yellowlees Method has 4 steps:
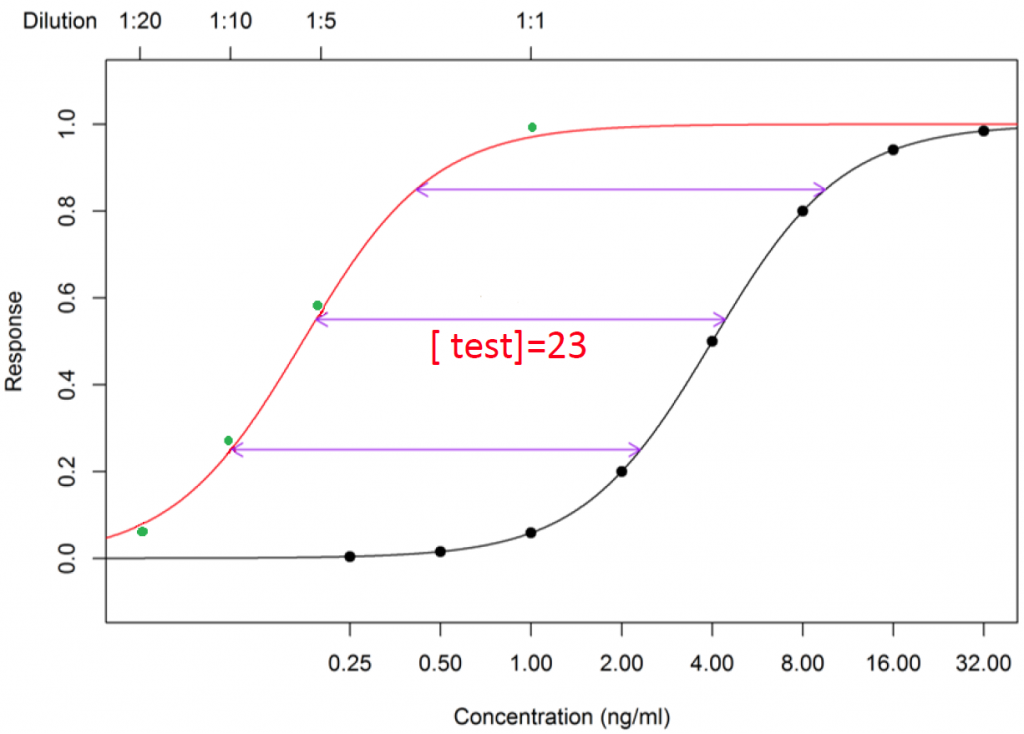
- Plot the standard curve as usual.
- Plot the unknown points on a dilution scale that aligns 1:1 with concentration = 1.
- Fit a 4pl with the same A, B, D parameters as the reference through the test sample points.
- The result is the difference in C parameters on the log scale. This will be identical to the answer obtained in the traditional method if all the points lie exactly on the curve.
The concentration of the 1:1 dilution is the test result = 23 in this example.
The test dose-response curve is thus (in this 4pl example) a 4pl with the same A, D and B parameters as the reference. The C parameter depends on the concentration of the test sample. Sliding the test sample left by 23 (on the log scale) brings the 1:1 dilution in line with a concentration of 1.
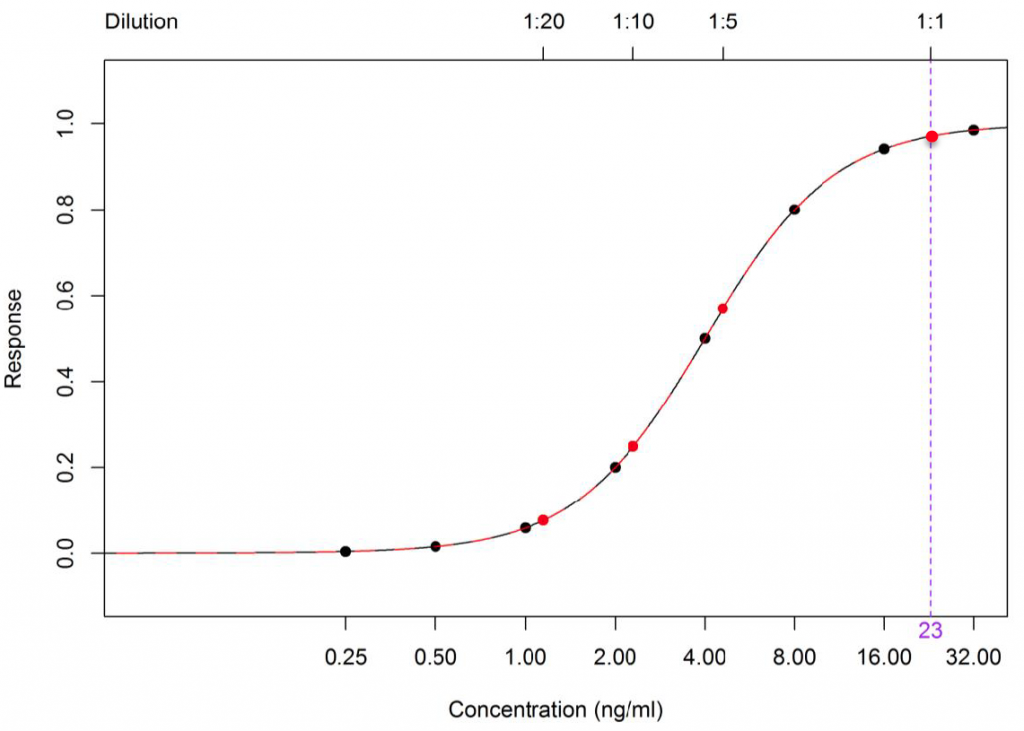
So, the unknown concentration is simply the horizontal shift required to align dilution 1:1 with concentration 1.
Note that optimising the curve fit to the points involves minimising the residuals – the vertical distance of the point from the curve. In this case, optimisation involves a horizontal shift only, so points towards the middle of the curve have a greater influence on the fit than those nearer the asymptotes.
The result is calculated with confidence limits which are derived partly from the fit of the test points to the parallel curve, and partly to the fit of the reference curve to the reference points.
What about variability?
As noted above, in practice the unknown dilutions will not lie exactly on the curve. The equivalent to taking the geomean in the standard approach is simply to optimise the fit of the 4PL to the test points, keeping A, B, D the same, and just adjusting the position on the x axis (the C parameter).
Suitability criteria
Using the Bursa-Yellowlees Method greatly simplifies the suitability criteria for the test samples.
Instead of several criteria that depend on absolute values of the reference curve, only 2 criteria are needed:
- Are the dilution points a good (reasonable) fit to the parallel curve?
a. F test for goodness of fit
- What confidence is required in the final result?
a. Confidence interval (CI) expressed as fold precision (Upper CI/Lower CI)
Key advantages of the Bursa-Yellowlees Method for ELISA Analysis
- Dilution points that are near or even outside the reference asymptotes still contain valuable information that need not be discarded. We know they are high (or low) and what the response value is. Disregarding these wastes valuable information. The Bursa-Yellowlees Method allows all such points to contribute to the end result, suitably weighted according to the confidence of the estimate. In effect, the lower and upper limits of quantification are removed.
- The method extracts the maximal amount of useful data from every point, and in general, fewer dilution points are required for the same precision of result compared with the traditional method.
- Samples that only have points outside the accepted range of the standard would normally require re-testing at different dilutions, taking more time and, importantly more sample stock. With the Bursa-Yellowlees Method, depending on the confidence required in the result, many such samples provide a reportable result.
- The method uses sample suitability criteria that are not dependent on absolute values derived from the standard curve.
- The method provides a direct test of the fundamental assumption that the sample dose response curve is identical to the reference curve.
These advantages are particularly important in high-throughput situations. In such case, reducing the number of samples per plate and reducing retesting can prove especially beneficial.
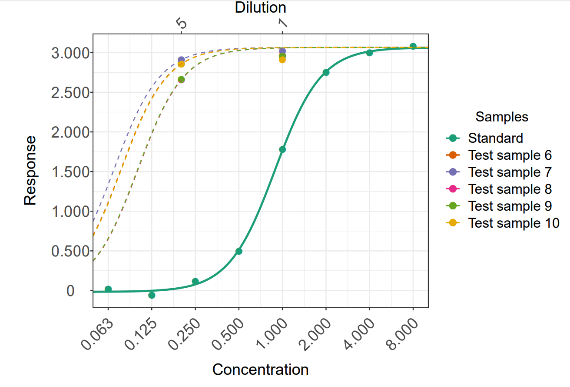
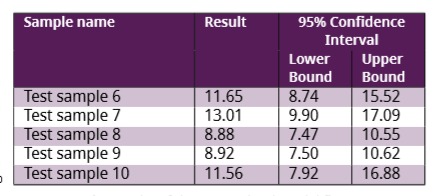
In the figure below, it is likely that none of these samples would have produced a result and re-testing would have been required at a higher dilution. Using the Bursa-Yellowlees Method, however, reportable results were obtained for each one, thus avoiding re-testing.
The Bursa – Yellowlees Method for ELISA analysis makes better use of data, reduces sample dilutions required, and greatly reduces re-testing. The results are more precise and more accurate than the standard approach. Suitability criteria are simple to set and do not depend on particular characteristics of the standard curve.