A Review of Statistical Hypothesis Testing
A clinical trial is often designed to demonstrate that a new treatment is performing better than the currently available treatment. To do this, one must show that there is a positive difference between the new and old treatments, and that this difference is statistically significant. To determine statistical significance, we use statistical hypothesis testing procedures. This blog will serve as background information for a follow-up blog on sequential (adaptive) trial designs.
The purpose of this blog is not to consider how the test statistic or its p-value are computed; this will depend on how the data are collected (for example see our blog on survival analysis). We instead will focus on the meaning of the significance level, making a conclusion and the implications on multiple hypothesis testing.
Key Takeaways
- Clinical trials often use hypothesis testing to evaluate whether a new treatment is superior to an existing one, using a predefined significance level as the threshold for statistical significance.
- A Type I error (false positive) occurs when the null hypothesis is incorrectly rejected; a Type II error (false negative) occurs when a true treatment benefit is missed. Regulatory frameworks emphasise strict control of Type I error.
- Repeated or multiple testing inflates the overall risk of a Type I error, so statistical adjustments are required to maintain the intended overall error rate.
Hypothesis Testing
Regardless of how the endpoint is defined or the statistical test being performed, hypothesis testing methods follow the same general framework. A hypothesis test can be broken down into 4 steps:
- Stating the null and alternative hypotheses;
- Specifying the significance level;
- Computing the test statistic and p-value;
- Comparing the p-value to the significance level to make a decision.
For the purpose of this blog, assume the following set of hypotheses:
Null hypothesis: The new treatment is equal to or worse than the current treatment.
Alternative hypothesis: The new treatment is better (superior) than the current treatment.
In reality, only one of these hypotheses is true, but which one is unknown to the researcher. Hypothesis testing helps us determine which hypothesis is most consistent with the observed data using a p-value.
Suppose the trial has concluded, all data have been collected, and the p-value has been computed. The p-value is then compared to the significance level to make a final decision.
- The p-value ≤ significance level → Reject the null hypothesis; conclude the alternative.
- The p-value > significance level → Fail to reject the null hypothesis.
Because our conclusion is based on sample data rather than the entire population, errors are possible. These are known as Type I and Type II errors.
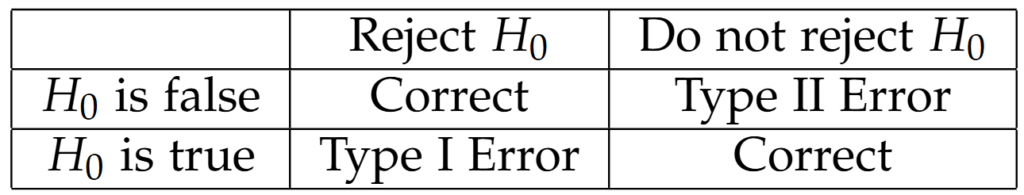
If we reject the null hypothesis when in fact it is true, we have committed a Type I error—falsely claiming treatment superiority. This is the primary regulatory concern. The significance (alpha) level, typically 5%, controls the probability of making a Type I error.
If we fail to reject a false null hypothesis, this is a Type II error—missing a genuine treatment benefit. Type II error is linked to study power and is accounted for in sample size calculations. This error represents lost opportunity for the treatment developer.
Multiple Testing
Assume the null hypothesis is true and the new treatment is ineffective. Suppose a clinical trial contains both an interim and final analysis, each tested at the 5% significance level. Individually, each test has a 5% chance of incorrectly rejecting the null hypothesis. However, across two analyses, the overall probability of making at least one false rejection becomes greater than 5%.
In other words, the more frequently a hypothesis is tested, the more likely a Type I error becomes. Regulators cannot accept an inflated false-positive rate, as this would increase the chance of approving an ineffective treatment.
Therefore, significance levels must be adjusted downward for each individual analysis to preserve the overall Type I error rate.
There are multiple ways to make these adjustments, each affecting sample size and the probability of early stopping. These considerations will be discussed in a future blog on adaptive trial design.