The Jonckheere-Terpstra test for ordered differences
Recently our team at Quantics were working on an analysis for an ecotoxicology client which called for us to use the Jonckheere-Terpstra test for ordered differences which is recommended by the OECD in their guidance document on statistical analysis of ecotoxicity data. We were subsequently asked to explain how it was used and we thought it would make a great subject for our Ecotoxicology blog, so here we go.
What is the Jonckheere-Terpstra test and what is it used for?
Key Takeaways
- The Jonckheere-Terpstra test is a rank-based, non-parametric trend test for ordered groups.
- It is commonly used in ecotoxicology to assess concentration–response trends without assuming normality.
- Key assumptions include independent observations, ordered groups, and similarly shaped group distributions.
The Jonckheere-Terpstra test is a non-parametric, rank-based trend test. It can be used to determine the significance of a trend in your data: whether an increase in one variable results in an increase or decrease in another variable. The Jonckheere-Terpstra test is often used in toxicology studies to assess whether there is a trend in the response with increasing concentration, i.e. a concentration-response relationship.
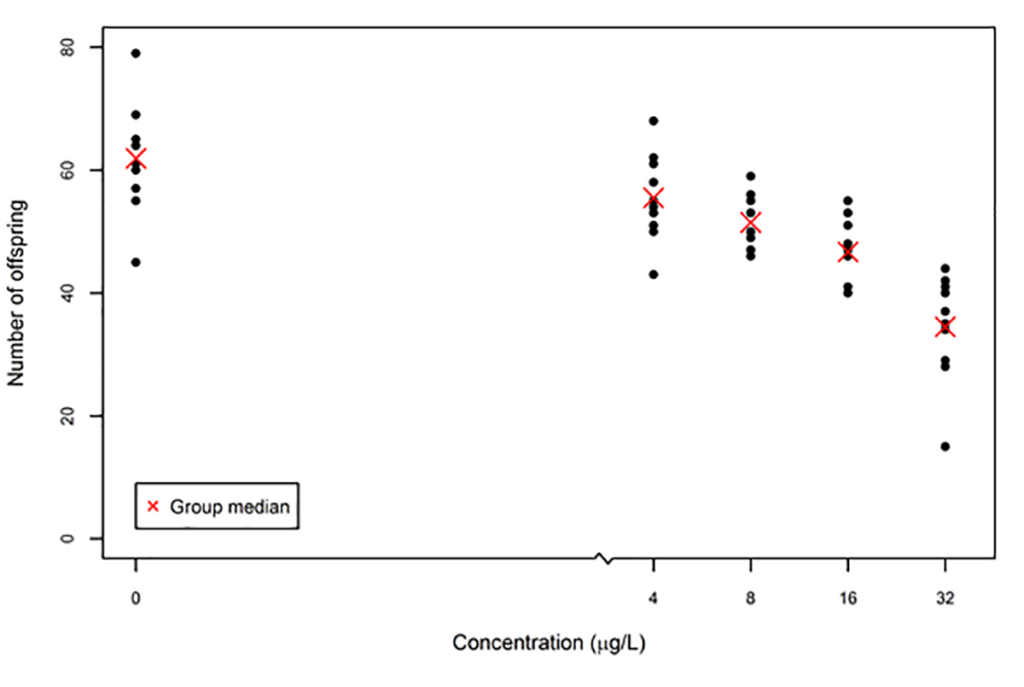
For example, if you have data on an organism’s response to a substance, such as the reproductive response of Daphnia magna exposed to a potential aquatic pollutant, you may need to test whether there is an increase or decrease in the number of offspring the Daphnia magna produce as the concentration of the substance increases. The following figure shows the number of offspring produced by each daphnid at each concentration, with the median number per daphnid in red.
How can the Jonckheere-Terpstra test be applied?
The Jonckheere-Terpstra test is testing for an ordered difference so the null and alternative hypotheses can be given by [1] and [2], respectively, as follows:
τ1 = τ2 = … = τK [1]
τ1 ≤ τ2 ≤ … ≤ τK (or alternatively, τ1 ≥ τ2 ≥ … ≥ τK) [2]
where at least one of the inequalities is strict (i.e. < or >, rather than ≤ or ≥), and where τi represents the effect, or the median number of offspring produced in exposure group i, from i=1…K.
The null hypothesis given by [1] indicates that the median number of offspring is the same at all concentrations, whereas the alternative hypothesis given by [2] indicates that as the concentration increases from 1 to K, the median number of offspring increases (or alternatively, decreases).
A few assumptions are key to performing a Jonckheere-Terpstra test:
- The dependent variable is either ordinal or continuous (e.g. number of offspring produced).
- The independent variable includes a minimum of two ordinal, independent groups (e.g. exposure groups).
- Observations are independent (each organism appears once and only in one group).
- The distributions in each group have the same shape and variability, differing only by location.
- The order of the groups and the direction of the alternative hypothesis were predicted prior to data collection.
The significance of a potential trend can be determined by first calculating a Jonckheere-Terpstra test statistic, followed by calculating an appropriate p-value. Several statistical programs have the capability to perform these calculations. First you must determine the appropriate method to calculate the p-value, as there are three different methods available, depending on the nature of the data.
- Exact test – The properties of an exact rank test depend on two characteristics:
- The response variable is either continuous or discrete, but if it is discrete, then there must be no ties in the data.
- There must also be a small sample size to perform an exact test (e.g. N < 100).
If these assumptions are met, both one-sided and two-sided exact p-values can be calculated.
- Permutation test – When the data are tied it becomes difficult to accurately assign ranks to observations with the same magnitude, so an exact test is no longer appropriate. In that case, the permutation test can be used to calculate an estimate of the exact p-value. A random permutation of the observed values is taken and, from this, the test statistic is calculated. This process is repeated X number of times. The p-value is then calculated as the proportion of the X test statistics that are less (or greater, depending on the direction of the alternative hypothesis) than the test statistic calculated from the original observed values.
Although the process involves a number of random permutations, the results will be consistent if the number of permutations is large enough; 1000 permutations is suggested for an accurate estimate of the p-value. The permutation test can also be used when the sample size is too large to use the exact test.
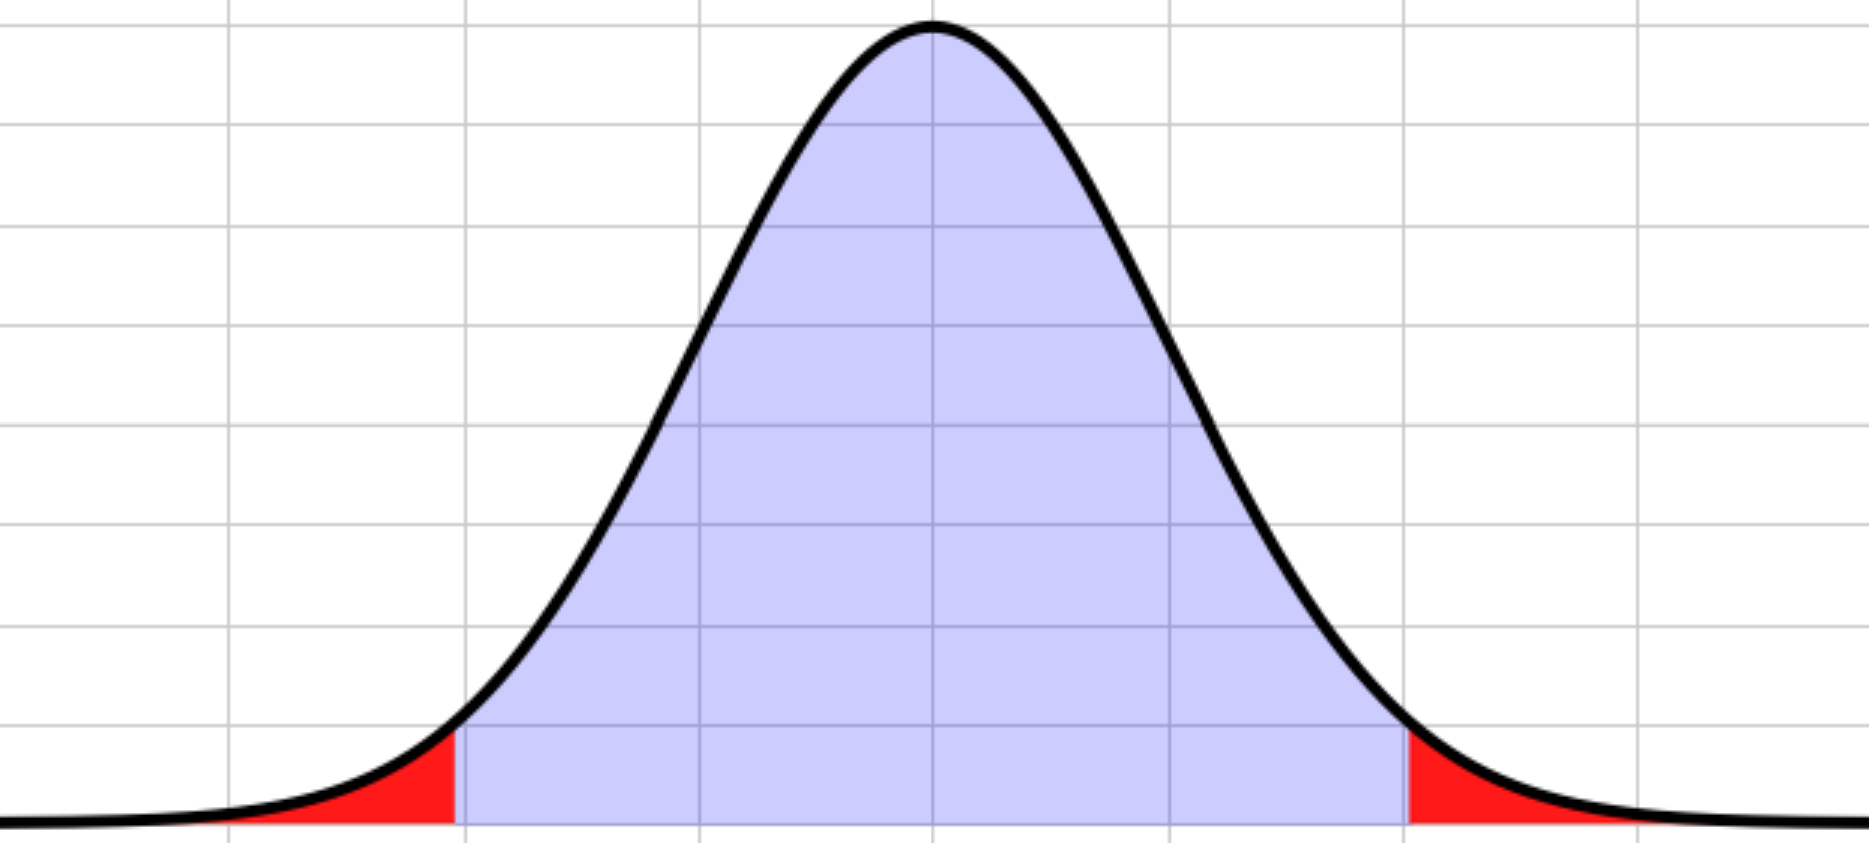
- Asymptotic test – When the sample size is sufficiently large, we can also make the assumption that the test statistic follows a standard normal distribution and calculate a p-value from this. The results of the asymptotic test should be consistent with the permutation test, provided the number of permutations is large enough (1000+).
What statistical programs offer this test?
Both SAS and R, amongst others, contain the functionality to perform the Jonckheere-Terpstra test. The ‘clinfun’ package in R can perform a Jonckheere-Terpstra test, with the exact test as the default if the sample size is less than 100 and there are no ties, otherwise the test defaults to the permutation test. SAS provides a Jonckheere-Terpstra option in the TABLES statement of the PROC FREQ command, which by default performs the asymptotic test but options are available to perform both the exact and permutation versions of the test. The SAS documentation also has extensive detail describing the calculations involved in deriving the test statistic and p-value.
When we perform the test in house Quantics often uses a diverse self-checking pair (DSCP) programing process, whereby the analyses are double programmed using SAS and R to validate and 100% QC the results.