Endpoints: Clinical Trial Design
In our last blog we discussed sample size choice and identified the key information that your statistician needs to know and why. In this second clinical trial design blog, we look at the different types of endpoints in clinical trials and some of the statistical issues they raise.
Read our blog on sample size choice here
An endpoint is a trial outcome value measured for each subject, such as objective tumour response (OR) or time to death (overall survival, OS). Responses are summarised for each treatment group (for example, objective response rate or median survival) and these summaries are compared between groups. A summary value itself is not an endpoint.
Key Takeaways
- Clinical trial endpoints are commonly classified as binary, categorical, continuous, or time to event, each requiring different analytical approaches.
- Endpoints must be clearly defined at the subject level; group-level summaries are derived from, but are not themselves, endpoints.
- Choosing appropriate summaries and visualisations helps ensure valid interpretation of treatment effects.
Below we outline four key endpoint types used in clinical trials, from the simplest (binary) to the most complex (time to event). This is an introductory overview, so please get in touch if you have more specific requirements.
Binary endpoints
Binary endpoints are simple yes/no measurements, such as:
- Dose-limiting toxicity
- Achieving a preset level of change (e.g. increase haemoglobin by 2 g/dL)
Categorical endpoints
For categorical endpoints, each subject is allocated to one category only. Common examples include tumour response categories:
- Complete response
- Partial response
- Stable disease
- Progressive disease
Another example is a Likert-type scale used to assess quality of life.
Continuous endpoints
Continuous endpoints are measured on a numeric scale, for example:
- Change in tumour size
- Visual analogue scale (VAS)
- Walking distance in a fixed time period
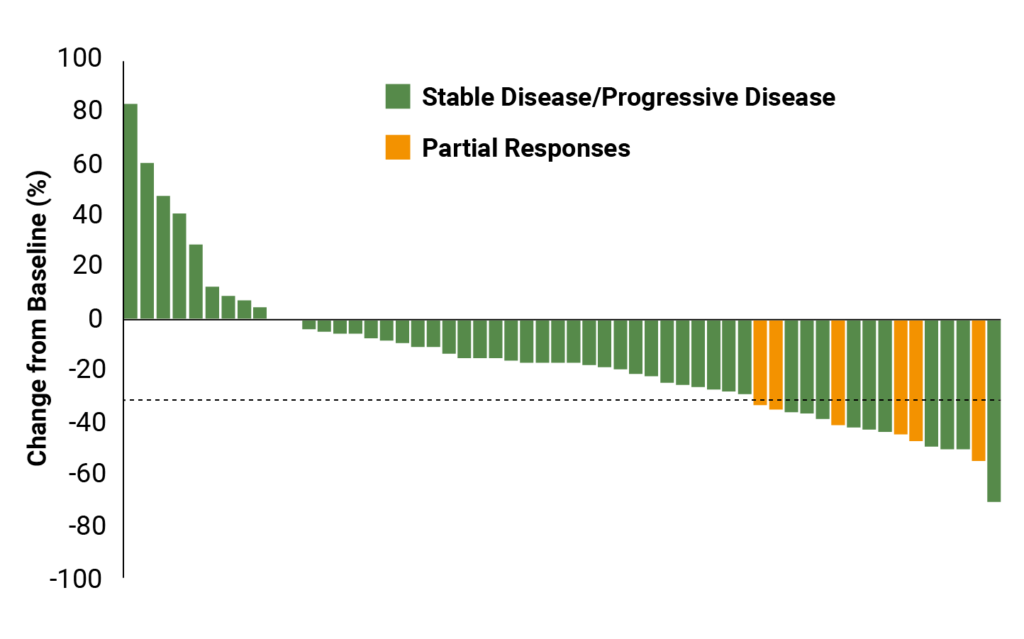
These endpoints are often displayed using waterfall plots (showing individual changes from baseline) or boxplots summarising group-level data.
Typical summary measures for continuous endpoints include:
- Sample size (N)
- Average (mean or median)
- Measures of spread, such as range, interquartile range (IQR), standard deviation, and variance

Time to event endpoints
Some continuous measures, such as survival time, may be limited by the length of the trial or by incomplete follow-up. In these cases the endpoint is not fully observed, but is known to exceed the observed follow-up time.
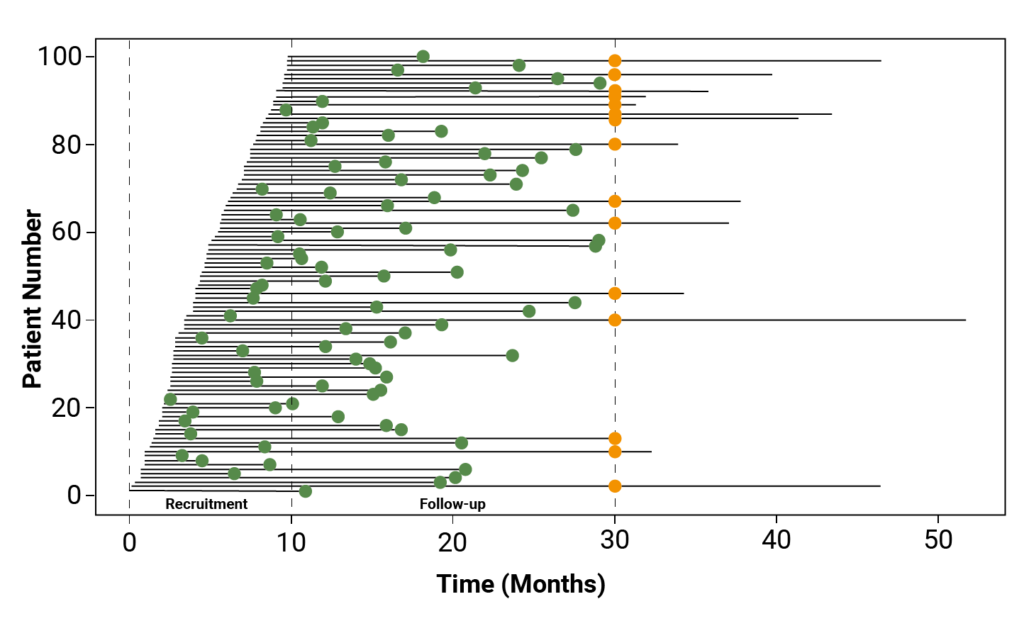
Time to event endpoints are usually measured from randomisation, ensuring a common starting point for all patients and maintaining comparability between treatment groups.
The most common graphical display for time to event data is the Kaplan–Meier curve. These curves show the probability of remaining event-free over time, account for censored observations, and allow estimation of quantities such as median survival.

In the next blog we will look at how group-level summary results can be compared statistically, and how trial results can be used to infer likely outcomes for the wider patient population.