Outliers are among the topics which stimulate the most vigorous debate among the bioassay community. When a datapoint falls outside of the usual range observed for that metric, it sparks a series of difficult questions. Is that point an outlier, or is it a result of variability? How can we tell the difference? If it is an outlier, should it be removed? The answers to these questions can be make-or-break for an assay, but you are likely to get different answers depending on who you ask. Here, we’re going to investigate outliers in bioassay and examine the effect they can have on bioassay results.
The heart of the controversy surrounding outliers is that, often, outliers are removed from datasets before the data are analysed. This seemingly flies against the scientifically rigorous nature of bioassay analysis, particularly in regulatory settings.
Key Takeaways
-
Outlier management in bioassays requires balancing scientific rigour with practical necessity, ensuring that only data with legitimate causes for exclusion are removed.
-
Simulation studies show that even a single outlier can significantly reduce the accuracy and precision of relative potency estimates, increasing both measurement error and confidence interval width.
-
Statistical methods are essential for identifying outliers when experimental causes are untraceable, highlighting the importance of robust, predefined outlier detection strategies in regulatory bioassay workflows.
If datapoints could be removed at will, assay results could be manipulated to show just about anything the researcher wants. One could easily mask the variability of an assay or make a flawed batch of product appear to pass its specification limits, leading to potential harm for the patient. As a result, all bioassay labs which perform regulatory assays have rigorous quality management systems in place, which typically include mechanisms to prevent data manipulation.
Simultaneously, it is reasonable to mandate that the data included in the analysis has a legitimate reason to be there. Imagine the relative potency of a batch of product was being assessed across several samples, and one of those samples was unknowingly diluted to 50% of its intended concentration in the assay. Clearly, this sample will give a far lower relative potency than the other samples at the intended concentration. Is it right to evaluate the suitability of the batch based on results including the errant sample? Arguably, to proceed with data from the overdiluted sample is as much a failing as to remove a legitimate datapoint. Scientifically, we are basing our conclusions on measurements which do not follow the specified experimental procedure. Practically, we risk a batch being unnecessarily rejected, which is a cost not only for the manufacturer, but could also prevent treatment from reaching a patient.
A balance, therefore, must be struck. Clearly, we do not want to be able to remove data arbitrarily, but there are cases where doing so is legitimate or necessary. This is the realm of outlier management, the process by which outliers are defined, detected, and, in some cases, removed. In order to perform outlier management, we must first outline what is considered an outlier. This can be viewed from a number of viewpoints, including the scientific, statistical, and regulatory perspectives.
Scientific: An outlier is a result inconsistent with the expected biological behaviour of the assay system. It could result from an experimental error – such as our overdiluted sample – or from an instability or an unexpected phenomenon within the assay system.
Statistical: An outlier is a result which lies outside the range of expected variability of the dataset, assuming it is drawn from a specific statistical distribution.
Regulatory: An outlier is a result which comes from a different statistical population to its counterparts, and results from human error or equipment malfunction. For example, USP <1032> states “If it [the result] comes from the same population … then the datum should stand” but “if it comes from another population and … is due to human error or instrument malfunction, then the datum should be omitted from calculations”. This definition combines the statistical and scientific perspectives.
It should be noted that these are high-level generalisations of the definition of an outlier within each field. Universal agreement is hard to come by, but these definitions give a sense of how key stakeholders in the bioassay lifecycle view outliers.
For drug manufacturers and bioassay analysts, the regulatory perspective on the definition of an outlier is of great importance. Importantly, a key implication in that definition is that data which shows unusual variability by chance alone should not be considered outlying.
In an ideal world, this approach strikes the balance we seek to achieve: only data which does not belong in the experiment would be removed. Would that it were so simple. Potential outliers are often only recognised once data analysis has begun, with no way to trace the result back to a potential cause. That means we are often reliant on statistics to determine the likelihood of a point being a true outlier worthy of exclusion or an unusual result which nevertheless ought to be included in the analysis.
Aside from the philosophical problems associated with including erroneous results in a dataset, what are the practical problems caused by outliers? Outliers can occur at every stage of the bioassay process, from spurious results among response values to outlying parameter values or relative potency results. We have chosen to limit the scope of our investigations into statistical outlier management to single point outliers. That is, the detection and removal of individual outlying response values in a relative potency assay. To support these investigations, we used simulation techniques to generate data with an outlying value deliberately added.
We simulated a series of relative potency bioassays consisting of a single test sample compared to a reference using a 4PL model. The model parameters for both the test sample and reference were identical. This means that the samples are parallel, and the true relative potency of the test sample is 100%.
The simulation method proceeded as follows:
- Find the response values from a 4PL curve at each of six doses,
 , where
  . The parameters of the curve were set as:
Parameter Value Zero-dose Asymptote 1 Slope Parameter 2.5 
3.25 Infinite-dose Asymptote 3 - At each of the six doses, randomly draw three points from a normal distribution. The mean of the normal distribution was the response value obtained from the 4PL curve at that dose, and the standard deviation was σ = 0.1. The drawn points are then considered a dose group of three replicates at each dose.
- If an outlier is to be added to the simulated data, randomly select one of the 6 dose groups for the test sample. Then randomly select one of the three replicates in that dose group. This replicate is then shifted up or down by 5 standard deviations (
 ) . If the chosen replicate was originally above the dose group mean, shift the replicate in the positive y-direction. If the chosen replicate was originally below the dose group mean, shift the replicate in the negative y-direction.
The magnitude of the shift was chosen as the shifted replicate then lies at least from the dose group mean. The probability of drawing a replicate more than from the dose group mean by chance is very low – approximately 0.00006%. This meant that exactly one point which we considered an outlier occurred in each generated dataset, allowing us to assess the effect of the presence of an outlier and the effectiveness of statistical outlier detection methods at detecting that outlier.
The data for the reference sample was generated identically, except that no outlier was added to the reference data. The data for both samples were formatted as a 96 well plate, and analysed using QuBAS.
We employed two metrics to evaluate the effect of the presence of an outlier on the relative potency of the simulated samples. We used the to encapsulate the measurement error of each set of relative potency results. This tells us, on average, how far the observed relative potency of the sample is from its true relative potency of 100%. We can interpret this as the “bias” introduced to the measured relative potency by the presence of an outlier. The smaller the AAD, the better the assay is performing.
We expect as many samples to have a relative potency above 100% as below 100%. We chose, therefore, to examine the absolute deviation, so these did not cancel to an overall deviation of zero on average. The AAD was calculated as:
![]()
Where is the relative potency as measured in the analysis and is the true relative potency as simulated.
We assessed how the presence of outliers affected the precision of the relative potency measurement using the precision factor (PF), which describes the width of the confidence interval on the measured relative potency. The PF is defined as:
![]()
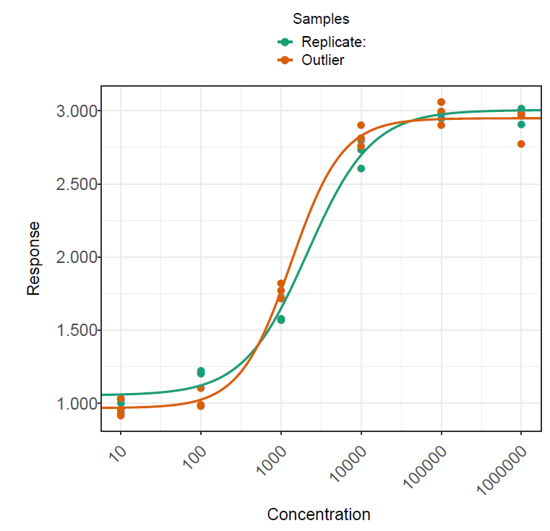
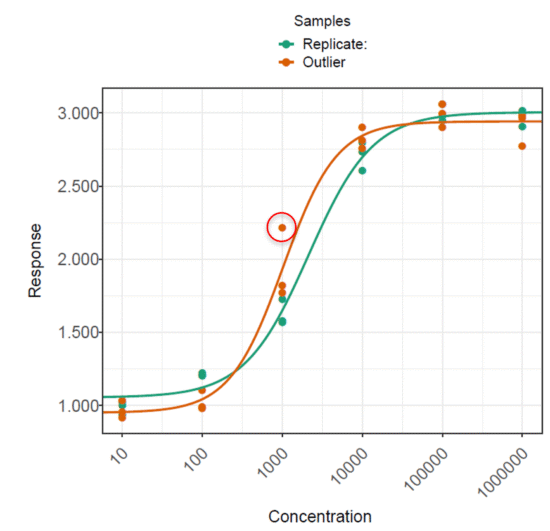
To isolate the effect of the presence of a single outlier in assay data, we generated a dataset of 100 plates with no outliers (Dataset 1). A second dataset was then generated by adding a single outlier to the test sample on each of the 100 plates (Dataset 2). These were then analysed in QuBAS, and the relative potency results summarised. Examples from each dataset are shown in figures below. Note that these are an extreme example chosen to emphasise the effect of an outlier on the curves and relative potency.


The plates in each dataset were analysed using the same method in QuBAS. Note that no outlier identification or removal was applied at this stage. The results are summarised in the table below.
| Dataset 1 (No Outliers) | Dataset 2 (Outlier Added) | |
|---|---|---|
| AAD | 10.8% | 14.9% |
| Geomean(PF) | 1.79 | 2.26 |
The results show that the presence of an outlier in the test sample led to approximately a 4% increase in measurement error on average, as indicated by a 14.9% AAD for dataset 2 compared to a 10.8% AAD for dataset 1. This tells us that samples with an outlier returned measured relative potencies which were, on average, further away from their true relative potency. Similarly, the average precision factor on the relative potency measurements of dataset 2 is greater than that for dataset 1. This means that the confidence intervals on the relative potency of test samples with an outlier are typically wider than those for test samples without an outlier, which we can attribute to the extra variability introduced by the presence of an outlier.
These results demonstrate the effect of an outlier on a relative potency measurement. It would clearly be extreme for an outlier to occur in every run of an assay – indeed, one would likely conclude that such points are a systematic error in that situation. However, we can conclude that outliers can decrease accuracy and precision of relative potency measurements. Even aside from the scientific concerns inherent to a less accurate and precise assay, the practical reality of such changes includes increased batch failure rates which, in turn, means increased costs both in labour and resources.
So, to maintain accuracy and precision, it is a good idea to develop a strategy for outlier management in bioassay. That begs the question: how do we identify outliers for removal? Next, we’ll examine different approaches to outlier identification, and assess their performance.


Comments are closed.