Reducing bioassay parallelism failures through better LOQ methodologies
Our recent paper, Estimation of Relative Potency from Bioassay Data that Include Values below the Limit of Quantitation (Francis Bursa, Kelly J. Fleetwood, Karie J. Hirst and Ann Yellowlees), discusses values below the limit of quantitation (“LOQs” – sometimes called “non-reportables”) which are a common issue with bioassay data, and specifically how to deal with them.
As discussed previously, there are two different types of assay data: continuous and quantal. For quantal data, measuring the response is usually straightforward: for example if the response is alive/dead, we simply need to count the number of living and dead organisms. For quantitative assays, however, the measurement process can be more complicated, and when the response is very low it may not be possible to distinguish it from no response at all.
Key Takeaways
- Values below the LOQ can distort potency estimates if handled poorly; excluding them introduces bias.
- Simple substitution (e.g., replacing with half the LOQ) can distort dose–response shape and trigger false parallelism failures.
- Tobit analysis, analogous to survival analysis, provides a statistically principled way to model censored responses below the LOQ.
There are a couple of ways of stating the lowest response that can be measured: a limit of quantitation (LOQ) is the minimum response which can be reliably quantified, whereas a limit of detection is the minimum response that can be distinguished from no response at all.
The substitution method
So how can we calculate a relative potency for an assay with LOQs? The simplest “solution” is just to ignore them. But this is clearly biased: we would end up ignoring low responses, but not high ones, so we would conclude that the response is higher than it actually is.
A more sophisticated approach, and one that is commonly used in bioassays, is the “substitution method”. This consists of replacing the unknown values with a particular low value – with the same value being used for every unknown response. The value used is usually one half or one third of the limit of quantitation.
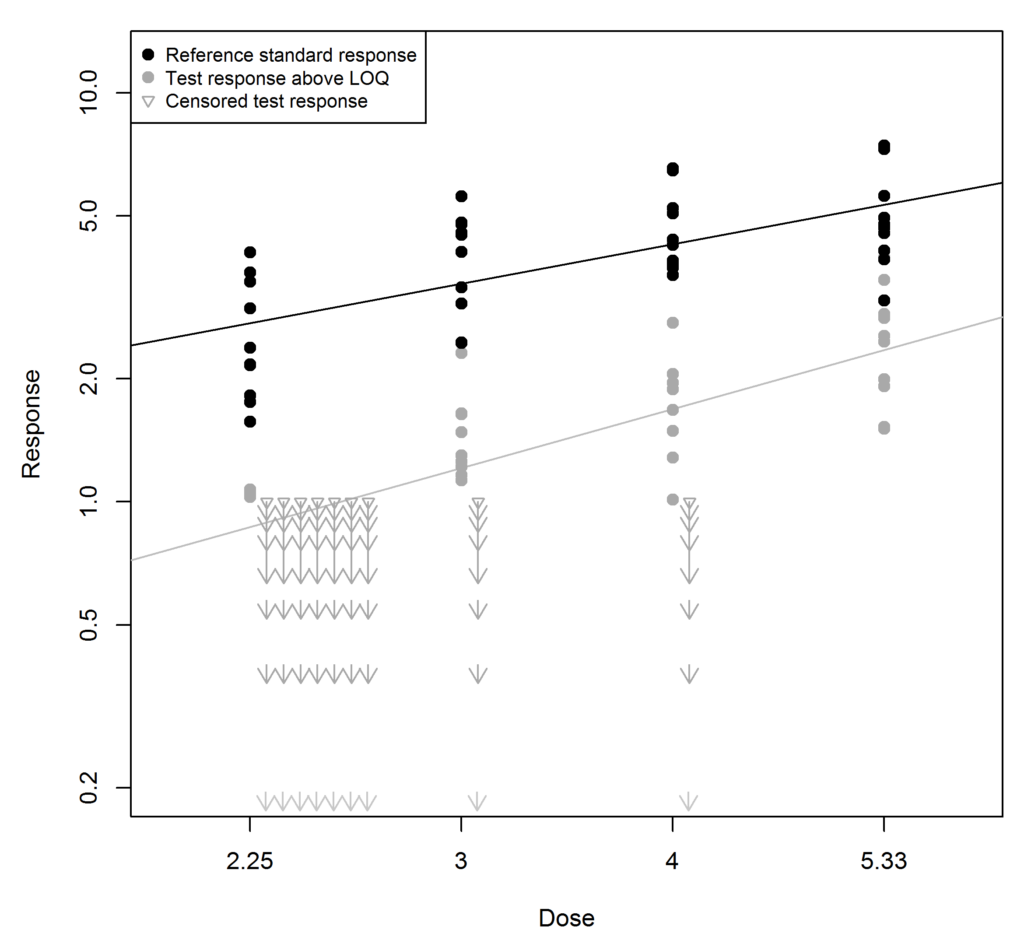
The substitution method is illustrated in the figure below. In this example the LOQ is 1. The reference standard responses (black) are well above 1. However the response for the test sample (grey) is generally lower, and nine of its responses are below 1. These have been substituted with the value 0.5 (half the LOQ) and are shown as triangles. When more than one LOQ value is recorded for a particular dose they are lined up horizontally.

At first sight, the substitution method seems reasonable: we know the unknown response must be somewhere between 0 and the LOQ, so why not choose the point half-way between? There are, however, two problems with this approach:
- We don’t expect the response in an assay to be the same at every dose – it should increase at higher doses. It would make more sense to substitute higher responses at higher doses. But how much higher?
- Bioassay responses are variable. It’s very unlikely that all the unknown responses are exactly the same, even within a dose group. It would make more sense to spread them out somehow – but how?
These are not just problems in principle, but in practice as well. Using the substitution method can lead to unnecessary parallelism failures. We can already observe the problem in the figure above: this assay was simulated to be exactly parallel but the result using this substitution method obviously isn’t.
At the lowest dose of the test sample, 7 of the 10 replicates were below the LOQ and were substituted with the value 0.5 – but in reality, they were all above 0.7, so this is an underestimate. This underestimate has the effect of making the best-fit line for the test much steeper than it should be. Depending on the suitability criteria used, this might lead to an incorrect parallelism failure and the assay would have to be re-run.
Survival analysis
Mathematically, an assay with LOQs is similar to clinical trials where the endpoint is survival. In a bioassay, the exact value of a response which is an LOQ is unknown, but we do know that it is at most a particular value (the LOQ). Similarly, in a clinical trial the survival time of a patient who is still alive at the end of a trial is unknown, but we do know it is at least a particular value, the duration of the trial.
In clinical trials, a method called survival analysis is usually used to handle this issue. For bioassays we can use a method which is almost the same (mathematically) as survival analysis: this is called Tobit analysis, after the economist James Tobin.
Tobit analysis
Tobit analysis makes only two assumptions:
- The responses are normally distributed.
- They follow a dose-response curve (in these examples, a linear model, but it could also be a four-parameter logistic).
These assumptions apply to all responses, both above and below the LOQ. The responses below the LOQ are unknown, but their distribution and dose dependence are still governed by the same model assumptions. These assumptions also answer the two questions raised above:
- How much higher should responses be at higher doses? They should increase according to the dose-response curve.
- How should LOQs be spread out? According to a normal distribution with the same standard deviation as the other responses.
Given these assumptions, Tobit analysis calculates the most likely values of the model parameters given the responses above the LOQ, the doses at which LOQs occur, and how many LOQs are present at each dose.
This usually gives more accurate results than the substitution method. The figure below shows the same data as the first figure, but this time Tobit analysis has been used instead of the substitution method. The best-fit line for the test sample is not as steep now, and the assay would be more likely to pass parallelism.
In our paper, we used simulations to compare Tobit analysis with the substitution method. One of the more interesting results is shown below. When relative potency is near 100%, there are very few LOQs and all methods give similar results. But for less potent test samples, Tobit analysis gives a much higher pass rate for the parallelism test than the substitution method.