

A key decision in the planning of a clinical trial is that of the sample size. As we’ve discussed previously, the number of participants in a trial is key to whether it will provide useful results – specifically whether the trial will have enough statistical power. Simultaneously, the cost and complexity of a trial can quickly escalate as the sample size increases, meaning the choice of sample size is a critical trade-off between minimising resource intensity and maximising the chance of obtaining a statistically significant result at a pre-specified threshold. Commonly, clinical trial sample size is optimised using frequentist methods: the chosen sample size is the smallest that provides the required statistical power given an appropriate Type I error rate, while accounting for real-world factors such as dropouts.
Such methods are not the only available option, however. Clinical trials are increasingly employing Bayesian approaches, including for sample size calculations. These techniques can more effectively borrow information from previous studies, which has the potential to reduce study sizes and, therefore, more efficient and cost-effective clinical trials. Here, we’ll explore the statistics behind Bayesian sample size calculations, discuss how this approach differs from the more familiar frequentist framework, and evaluate the advantages and disadvantages of both methods.
Key Takeaways
-
Unlike frequentist methods that assume a fixed treatment effect, Bayesian approaches represent the treatment effect as a probability distribution (a prior), allowing uncertainty to be incorporated directly into the design process.
-
Bayesian power (or assurance) measures the probability that a trial will succeed averaged over a prior distribution. This means the probability of trial success is evaluated across all plausible treatment effects, weighted by how likely each effect is believed to be.
-
The choice of prior strongly influences the required sample size. Optimistic priors suggesting larger treatment effects may result in smaller required sample sizes, while sceptical or highly uncertain priors can require much larger studies or may never reach the desired probability of success.
Bayesian Statistics
Much of the statistics used in clinical trials is based on the trends in data that would emerge if you ran an experiment many times. This is known as frequentist statistics, and at its heart is the idea that the key properties we want to know – referred to as parameters – are fixed, but the data we use to infer them – that which we measure in our experiments – are random. We must account for this random variability in our collected data to make a well-informed estimate of the parameter.
For example, we might be interested in whether the efficacy of a new drug in a given population is sufficient for it to be licensed. This efficacy is a parameter, which a frequentist would view as fixed. To estimate this efficacy, we conduct a clinical trial and collect a set of data. Frequentist inference might then proceed as follows: if we assume the efficacy of the drug is not sufficient for licensing, how likely is it that we would observe the data we have collected? For a frequentist, the observed data with its underlying randomness is informed by the fixed parameter.
The Bayesian interpretation takes a different – indeed, in some sense opposite – view. Under Bayesian reasoning, parameters are random. They are described by a probability distribution which encodes the likelihood of observing a particular value in an experiment. Data, conversely, are not treated as random, but are instead used to inform our understanding of the probability distribution which describes the parameter of interest.
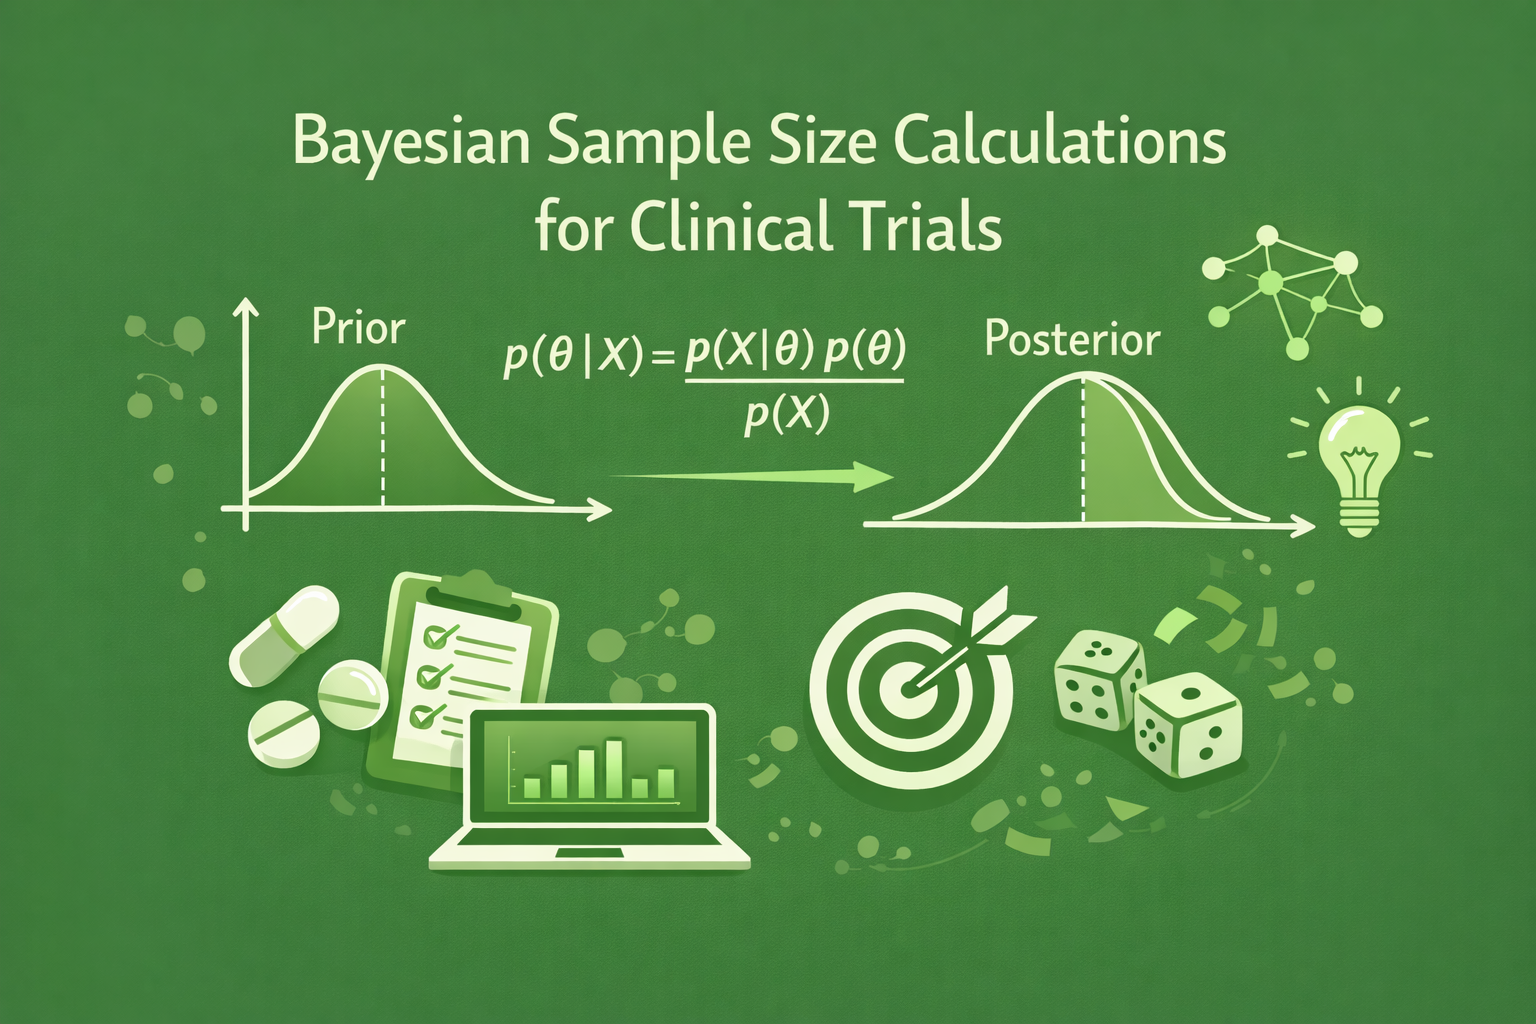
In the case of our drug example, a Bayesian approach would first start with a prior. This is an assumption about how the parameter – here the drug’s efficacy – is distributed. This can be informed by previously collected data, or we could keep our assumptions to a minimum – a so-called uninformative prior. We then collect data in the clinical trial, which we use to update the parameter distribution – the resulting distribution is known as the posterior. Bayesian inference might then be: given the data we have collected, what is the probability that the parameter takes a particular value when measured? For a Bayesian, data updates our understanding of the shape of the probability distribution from which our parameter value is randomly drawn.
Bayesian reasoning, therefore, begins with a prior distribution and uses collected data to update that prior to form a posterior distribution. This process is encoded in Bayes’ Theorem. For an outcome of interest  (say, a parameter taking a certain value) and a set of collected data
  , Bayes’ Theorem states:
![\[p(\theta|X)=\frac{p(X|\theta)\cdot p(\theta)}{p(X)}\]](https://www.quantics.co.uk/wp-content/ql-cache/quicklatex.com-cb1719354ec4c4dcb86482f9079e1d13_l3.png "Rendered by QuickLaTeX.com")
 means the probability of observing
  given
given  – this is known as a conditional probability. The components of Bayes’ Theorem are, therefore:
 : the probability of observing outcome given the data – this is the posterior
 : the probability of observing the data assuming an outcome – the likelihood
 : the probability of observing independent of the collected data – the prior
 : the probability of observing the data independent of any assumptions about the value of the parameter – the marginal likelihood
Bayesian Power
The fundamental principle of a sample size calculation using Bayesian methods is similar to that when using frequentist methods. We must find the smallest sample size which gives an appropriate probability of the trial succeeding.
In the frequentist picture, we quantified this probability using the statistical power – the probability of correctly rejecting the null hypothesis, assuming certain true underlying values for involved parameters. Note that hypothesis tests in clinical trials are typically set up so that the null hypothesis represents a failure of the trial – the null might be there is no evidence that the drug is more effective than placebo, for example.
So, the statistical power tells us about the probability of the trial being successful. Under an assumption about the size of the treatment effect, we can estimate a sample size which would give the trial an acceptable statistical power. This might be set at 80% – this represents an 80% chance of correctly concluding that the drug is truly more effective than placebo if the assumptions on the underlying parameters are true. The other 20% is the chance that the true efficacy of the drug is obscured by random variability in the trial, meaning we incorrectly conclude that the drug is not more effective than placebo.
In the Bayesian picture, we must still make an assumption about the true treatment effect to calculate a sample size. But, instead of assuming a fixed value, we utilise the distribution of the treatment effect parameter as a prior. Notice how this relates to the treatment of parameters by frequentist and Bayesian approaches. Frequentism requires that the “true” treatment effect of a drug be fixed, meaning we must assume a single value. In the Bayesian view, the treatment effect is regarded as drawn randomly from a probability distribution, so it is represented by that distribution when calculating the sample size.
For example, you might think that the treatment effect of a new drug is likely to be equal to two units. Depending on population characteristics, however, it could be as high as five units or as low as 0.5 units. This uncertainty in the “true” parameter value is encapsulated by the distribution representing the parameter.
The Bayesian counterpart of frequentist statistical power is, perhaps unsurprisingly, known as Bayesian power (PB). This term is used somewhat interchangeably with the term “assurance” – the FDA use Bayesian power, so that’s what we’ll stick with here. Bayesian power is defined in the FDA’s latest draft guidance (published January 2026) as “the probability of meeting the success criterion, averaged over a prior distribution”, following Spiegelhalter et al. Mathematically, this gives us the following formula:
![\[P_B=\int p(Success|\theta, n) \cdot p(\theta) d\theta \]](https://www.quantics.co.uk/wp-content/ql-cache/quicklatex.com-583b68cc6a1ad633c167007a20007a93_l3.png "Rendered by QuickLaTeX.com")
Ok, this may appear intimidating (especially as a wild integral has appeared), so let’s investigate this formula a bit further.  is the probability of the success criterion being met given a certain treatment effect and sample size
  . is the prior distribution of the treatment effect – this is our assumption about what we expect the true treatment effect to be.
So, the formula tells us to look at every true treatment effect and assign each one a probability of being observed – this is the prior. We then multiply this probability with the probability of the trial succeeding if each value of was to be observed, given a sample size . Finally, we do this for all values of , and add it all up – that’s what the integral means.
In essence, this means that the Bayesian power is a sum of the probability of success of the trial for every treatment effect, weighted by our assumption of the likelihood of each treatment effect being observed. Note that this integral could, in theory, span the full range of valid values for . In practice, we can restrict the range of the integral to those values of we consider possible. This is because the prior probability of values which are considered impossible is, of course, zero, meaning these values do not contribute to the sum.
We can also interpret this graphically. Figure 1 shows plots of the components of Bayesian power. In the left panel, we see the prior distribution of the treatment effect. This follows a normal distribution.
The centre panel shows the probability of success for a given treatment effect and sample size. As we might expect, this follows a sigmoidal shape: the probability of success remains approximately zero until a treatment effect of about zero (i.e. the drug is about as good as placebo) and then increases rapidly with treatment effect. Above a treatment effect of about 0.4, the probability of success is maximised at 100% in our example – the drug is so effective that the trial is guaranteed to be successful.
Finally, the right panel shows the product of these two curves. We can see the influence of the prior distribution in its normal character – a tall peak with the curve dropping away into the tails – but also the influence of the probability of success: there is more probability in the upper tail than the lower tail, for example. The area under this curve is the Bayesian power.


We can see the influence of sample size in Figure 2. In both plots, the blue curve represents a sample size of 25, the orange a sample size of 100, and green a sample size of 400. The prior is independent of sample size, so this remains the prior shown in Figure 1.
In the left plot of Figure 2, we see that the greater the sample size, the steeper the conditional probability curve. As the sample size increases, the trial is more likely to be successful even if the treatment effect is small, so the steep transition region of the sigmoidal curve begins closer to zero.
In the right plot of Figure 2, the height of the product curve increases with sample size, and the peak shifts to the left. This indicates that the Bayesian power of the trial increases with sample size: the taller and wider the curve, the greater the area underneath it.


To calculate the required sample size, therefore, a prior must first be selected. Then, the conditional probability curve based on that sample size can be calculated, and combined with the prior to give a Bayesian power. The sample size can then be optimised by trial and error to find the value which gives the desired Bayesian power.
Choosing a Prior
It is important to distinguish between the design prior and the analysis prior. The analysis prior is the prior which is used when conducting the final study analysis, and is constructed using an in-depth process often involving external information. Design priors, on the other hand, are assumptions made when evaluating study design characteristics such as sample size and Bayesian power. An example of a design prior might be one centred on the Minimal Clinically Important Difference (MCID), which is the smallest treatment effect which is considered beneficial to a patient. For any one study, a range of design priors should be considered, potentially including optimistic, sceptical, and weak or non-informative priors.
The choice of design prior is a strong influence on the calculation of the required sample size. As a result, it is common to report a range of sample sizes, with a minimum sample size under an optimistic prior and a maximum sample size under a more pessimistic prior. In all cases, the reported sample size will be the minimum required to achieve a target Bayesian power. Exploring multiple design priors also gives information about the sensitivity of the trial – there is no guarantee that the Bayesian power will reach a given target even with an infinite sample size for some priors.


Examples of design priors are shown in the left panel of Figure 3. Included are priors centred on three possible positive treatment effects: (green), (red), and (purple). Also shown are a sceptical prior (blue), centred on a treatment effect of zero, and a weak prior (orange) which emphasises uncertainty about the true value of . In the right panel of Figure 3, we see the relationship between Bayesian power and sample size under each of these priors. The blue dashed line marks a Bayesian power of 80%. Notice that, for the three optimistic priors, the required sample size to reach a Bayesian power of 80% decreases as the most likely treatment effect for the assumed prior increases. This is a sensitive relationship: the required sample size is 75 for the prior centred at  , but 189 for the prior centred at
  . It makes sense, therefore, to explore design scenarios close to the prior considered most appropriate to understand the range of possible sample sizes which could be required.
For the sceptical and weak priors, we see that, even up to a sample size of 400, the Bayesian power never reached the 80% threshold. Indeed, it can be shown that it will never reach that threshold, even for an infinite sample size. This indicates that, in either of these scenarios, we will never be able to conclude that the treatment is effective with the required power. This is expected: In a scenario where the treatment effect is close to zero or very uncertain, then it is very unlikely that we would correctly conclude that the trial has been successful no matter how large the sample size.
Why Choose Bayesian?
The standard clinical trial playbook has been frequentist for several years, so why might one decide to use a Bayesian approach? The use of priors to provide a more realistic representation of the uncertainty surrounding a treatment effect can be useful when calculating a sample size. Using frequentist methods, one must assume a point-value treatment effect to calculate a sample size which does not account for any uncertainty. Under the Bayesian approach, the treatment effect is only ever treated as a probability distribution, meaning uncertainty is incorporated even if only a single prior is considered. This idea of “averaging over uncertainty” often provides more realistic probabilities of success than under frequentist methods.
More generally, the use of priors can lead to smaller or more efficient trials by incorporating external information. External information can be used to decrease uncertainty in the prior, which can lead to a smaller sample size to achieve a desired Bayesian power. Consider, for example, the difference in Bayesian power gained from the optimistic priors and the comparatively uncertain weak prior from our example earlier. This can mean that Bayesian approaches are particularly useful for trials in small populations, such as for rare diseases or paediatric medicine.
The strong dependence on priors, however, also has its drawbacks. The assumption of a prior is just that – an assumption – and disputation of what priors are considered reasonable is not uncommon. As a result, the choice of priors used when conducting a trial under Bayesian methodology requires strong regulatory justification, including demonstration of the suitability of any external data incorporated when constructing the prior. Indeed, the FDA guidelines state that “The time needed for FDA and the sponsor to align on an appropriate prior should be considered in the development of the intended trial”, and suggest simulations for examining the impact of various priors.
A final drawback of using Bayesian methods is their high computational complexity when compared to frequentist methods – indeed, this is at least partially the reason why frequentism has dominated statistical practice until recent years. While advances in the availability of computational power and the development of methods such as Markov Chain Monte Carlo (MCMC) simulation have increased the accessibility of Bayesian methods, it is still the case that such methods are more complex to implement effectively. Nevertheless, the amount of resources and guidance for best practice is increasing as Bayesian methodologies are becoming better utilised in the industry.


Comments are closed.