Bayesian Dose Selection for Vaccine Studies
All trials for new medical products require efficient use of subjects and resources, and vaccine studies are no exception; it is imperative to ensure that the information gained from each and every subject is maximised. To this end, the choice of which doses of vaccine to include in preclinical and early phase studies is an important consideration. Choose incorrectly and the study may be uninformative, so a careful and considered approach to selecting dose levels is a crucial component of preparing for a vaccine study. Here, we’ll examine one such approach in the context of in vivo challenge studies: Bayesian dose selection, which utilises information about survival and immune markers to inform dose levels for future study groups. We’ll discuss the statistical processes behind Bayesian dose selection for vaccine challenge assays and follow the procedure used to determine the most informative dose.
Key Takeaways
- Bayesian dose selection helps maximise the information gained from each subject by combining prior knowledge with newly collected data to identify informative vaccine dose levels.
- The most informative doses are those close to the breakthrough dose, where approximately 50% protection is expected and the dose-response relationship can be characterised most efficiently.
- Including correlates of protection can improve dose selection by linking immune marker data with survival outcomes, supporting vaccine development when human efficacy studies are not feasible.
Vaccine Challenge Studies and Correlates of Protection
Before a vaccine – or any drug product – can be made available for public use, researchers must demonstrate its safety and efficacy. In short, we need to know whether the vaccine causes any side effects and, if it does, how severe these are. We then must understand whether the vaccine is effective at preventing the target disease.
There are several possible study approaches available to researchers for making these determinations, one of which is the challenge study. This method utilises otherwise healthy subjects who are given a dose of the vaccine before being “challenged” by exposure to the target disease. The outcomes for treatment groups of subjects are then compared to those for a control group of subjects who did not receive the vaccine before being challenged.
Many challenge studies – particularly those targeting severe diseases – utilise non-human subjects and are, therefore, in vivo studies. It is imperative that the study population is kept to a minimum. One reason for this is ethical: all subjects in in vivo trials are euthanised at the end of the study, and any which die as a result of the challenge will experience disease symptoms even when all steps are taken to minimise their suffering. From a practical perspective, a smaller study population means fewer subjects need to be kept, fed, and watered, which reduces the cost of the trial.
These constraints require that the study be conducted to maximise the information gained from each subject. This includes the endpoints chosen for the trial. In some cases, the main outcome of interest is simply the survival of the subjects: how many of each treatment group survived the duration of the trial compared to the control group? This, however, often is not the most efficient use of data. A continuous measure, such as time to death, can often provide a more precise estimate of efficacy endpoints, allowing acceptable results to be obtained using a smaller study population.
Many studies also measure immune markers, such as antibody titres, in subjects which may be stimulated in response to the vaccine. This allows for a correlation to be drawn between the level of the immune response and the protection provided by the vaccine. Perhaps unsurprisingly, therefore, these markers are known as correlates of protection (CoPs). Assessing CoPs is particularly crucial when placebo-controlled challenge studies for efficacy in humans are not feasible. In these circumstances, there are special regulatory frameworks for licensing vaccines, such as under the FDA’s Animal Rule. Human subjects can be dosed with the vaccine to measure their immune response for these CoPs, which can then be compared to the responses in the non-human in vivo model to infer the level of protection that can be expected for humans without requiring human subjects to be exposed to potentially deadly diseases.
Dose Selection
No matter what endpoints are chosen for the study, dose selection can be crucial for ensuring that subjects are efficiently utilised. We typically expect that the greater the dose of vaccine delivered, the stronger the protection (up to a point) provided by the vaccine.
We do not, however, expect this relationship to be linear over a wide range of doses. Instead, we often observe an “s-shaped” sigmoidal relationship. For low doses of the vaccine, we expect very little protection, meaning few, if any, subjects in an in vivo challenge study will survive. Conversely, high doses will generally confer strong protection and close to all subjects surviving. These are the flat regions, or asymptotes, of the sigmoidal curve.
The key to understanding the performance of the vaccine lies in between these two extremes. Specifically, in the region of the curve where the protection provided by the vaccine increases quickly with dose – the linear region. Within this region will be the dose which provides 50% protection, often called the breakthrough dose. In order to properly characterise the curve, we must locate this steep rise between zero protection and 100% protection, but this is a difficult proposition. The linear region is narrow: the majority of possible doses will provide either zero or 100% protection, meaning the asymptotes will be well defined, but there will be comparatively very little information about the narrow linear region unless careful choices are made in dose selection.
This is of particular importance when we consider the efficient use of subjects in the study. We gain very little information from increasing the number of observations on the asymptotes of the curve, so every additional subject who receives a dose which is guaranteed to provide zero or 100% protection is a subject used inefficiently. By contrast, the most informative doses are those which provide protection between zero and 100%, as these lie in the linear region. This informativity is maximised when the expected protection of a given dose is 50%. In this situation, whether a subject lives or dies provides the strongest possible constraint on the location of the linear region, and, as a result, the minimum protective dose of the vaccine.
The challenge, therefore, of dose selection is to determine what that critical dose is. This then informs study design for later efficacy trials. Specifically, the sample size for dose groups close to the breakthrough dose might be larger than for less informative doses.
Bayesian Dose Selection
How, then, can we efficiently identify a series of doses which maximises the information gained in the study? Note that it is still important to consider a range of doses, particularly if we are looking to establish a relationship between CoP levels and survival.
One approach uses Bayesian modelling. As we’ve explored in the context of sample size calculations, Bayesian statistics combines previously collected information (the prior) with novel information to estimate the likelihood of a certain outcome (the posterior). The posterior can then be treated as a prior itself and updated by further new information through a process known as Bayesian updating. This means the estimate of the probability of the outcome of interest can be continually refined as more information is collected. Bayesian statistics is often contrasted with frequentist statistics, which considers the rate at which the outcome of interest occurs over a series of many experiments to calculate probabilities.
Now, we are most interested in finding the vaccine dose where the survival percentage is 50%: the breakthrough dose. To do this, we assume the relationship between survival and vaccine dose will follow a sigmoidal curve described by a set of model parameters. This initial curve will be our prior: in the first instance, it will be informed by existing information about the protectivity of the vaccine. This might use information from pilot studies, for example. Once the curve is set, we can use simulations to determine the survival probabilities for a range of doses.
These simulations often use a technique called Markov Chain Monte Carlo or MCMC. This is a method to describe the posterior distribution for complex models where an analytical solution may not be possible. A large number of samples – often tens of thousands – of the model parameters are taken from the posterior, and a distribution is found for the key quantity of interest – here the survival rate at a given dose – using each sample.
Across these sampled distributions, we aim to find test doses which provide the best chance of being at (or near) the breakthrough dose, representing a 50% survival rate. If a test dose is below the breakthrough dose, then the survival probability for the sample will be less than 50% on average. Conversely, if a test dose is higher than the breakthrough dose, then the average survival rate for the sample will be high.
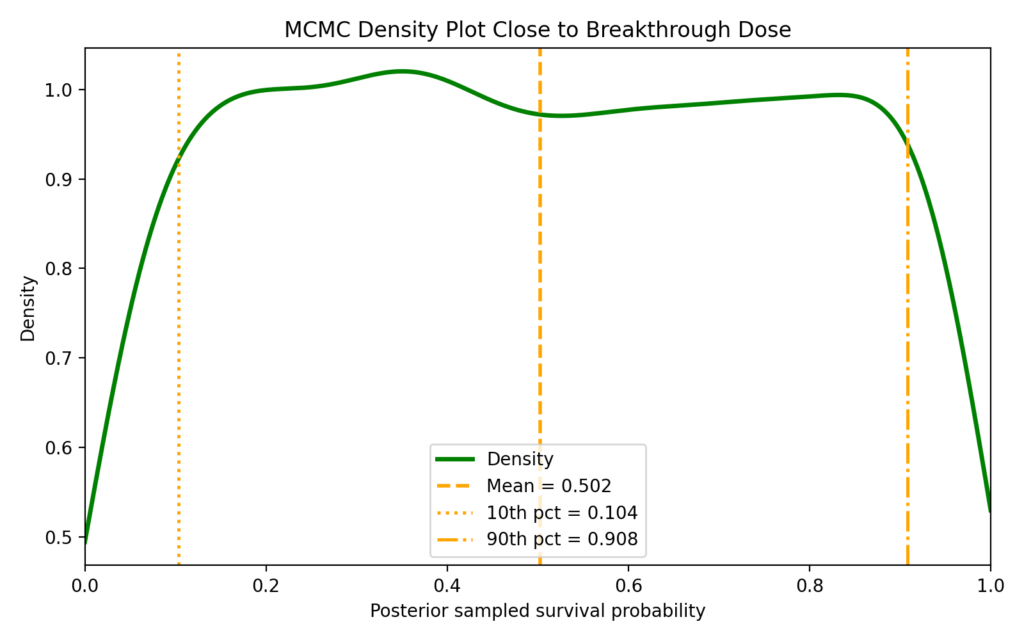
For a dose where the probability of survival is close to 50% – that is, close to the true breakthrough dose – we would expect to see a fairly even distribution of the probability across the possible survival percentages. This tells us that the survival rates are very sensitive to the sampled model parameters. Therefore, the dose is as likely to be above the breakthrough dose as below, so we have more or less a 50/50 chance of getting a high survival rate or a low survival rate.
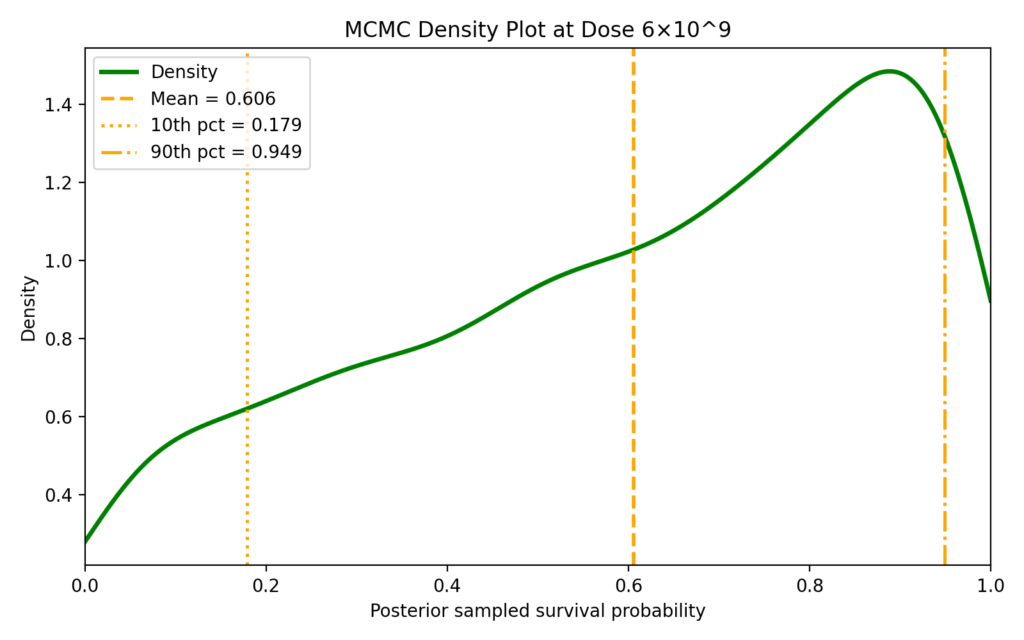
Now consider a test dose which is well above the true breakthrough dose. We observe more samples with high survival rates, therefore the distribution is skewed towards high survival rates.
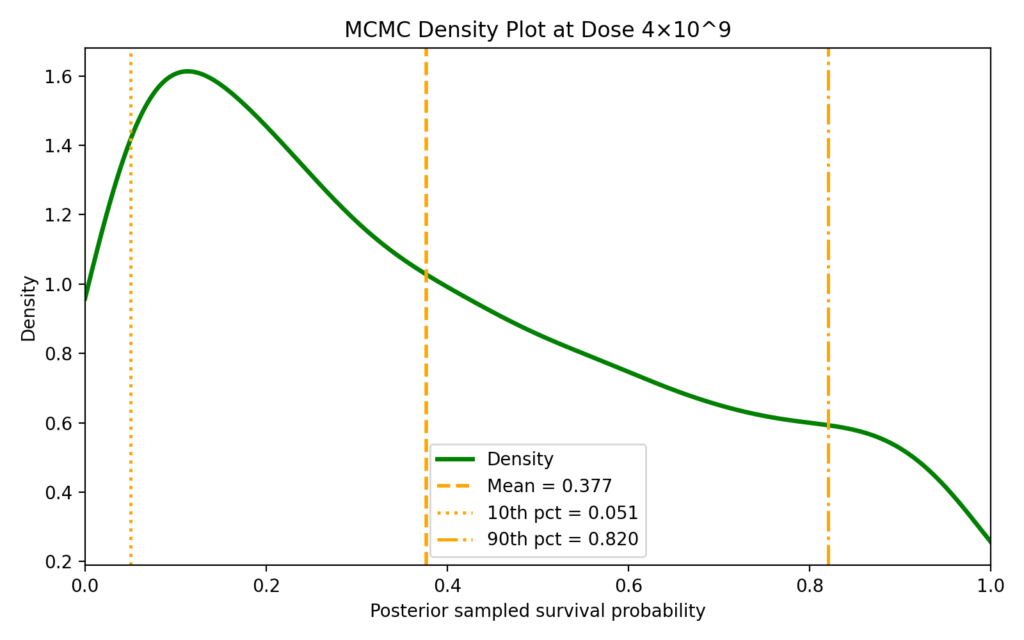
Similarly, if the test dose is well below the breakthrough dose, we will end up with a distribution which is skewed towards low survival rates.
The expected survival rate at each test dose can be estimated by finding the average survival rate across the MCMC samples. If the average survival rate is close to 50%, this is an indication that the test dose is close to the true breakthrough dose. In practice, we might find a range of doses which give survival rates close to 50%. This allows us a better characterisation of the region of the curve around the breakthrough dose than if we were to try to pinpoint the breakthrough dose too precisely. It also increases the robustness of the experiment to if, say, there is variance in dose administration.
Imagine the true breakthrough dose for a certain vaccine was 5 × 10⁹ units. The results of a dose selection study might be:
|
Dose (units) |
Sample size |
|---|---|
|
0 (negative control) |
2 |
|
4 × 10⁹ |
5 |
|
4.5 × 10⁹ |
5 |
|
5.5 × 10⁹ |
5 |
|
6 × 10⁹ |
5 |
|
1 × 10¹⁰ |
2 |
We have targeted most of the subjects in the study at the region close to the breakthrough dose as this is the most efficient use of resources. The linear region of the curve is the most uncertain region, meaning we require more data to characterise it well. We still, however, maintain some subjects in dose groups which are expected to have very high and very low survival rates to ensure the asymptotes are well characterised.
So far, we have considered a very simple model which is only interested in the expected survival of subjects. However, we can increase the level of detail of our predictions by including information about correlates of protection. Specifically, the relationships between dose, CoP levels and survival can be explicitly included in the priors of the model. If we determine the relationship between CoP level and protection, then we can add an additional layer of modelling: first, we calculate the expected CoP level for the test dose, before using this to inform the expected survival rate. The addition of CoP data means that our eventual estimate of the breakthrough dose will be better informed than had we used survival data alone, which can improve the targeting of subjects to dose groups near the breakthrough dose.
Why Bayesian?
Historically, dose selection has been a game of rules of thumb, using intuition and experience to predict where the breakthrough dose fell. Even when calculations were possible, the lack of information often meant that confidence was low. Bayesian techniques can help counter these problems. By explicitly incorporating previously collected information in the form of priors, Bayesian statistics can often draw meaningful conclusions where other approaches may not have been able to. In doing so, such calculations can aid researchers in better targeting of subjects to the most informative dose groups, resulting in more efficient clinical trials and, eventually, cheaper vaccines.