The model for the standard curve is:

The model for the test sample is then:
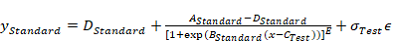
Where for the reference standard and the test sample respectively:
-
-
 and
and  are the asympotes
 -
 is proportional to the slope at the mid-point.
 -
 represents the asymmetry, and is non-negative.
 -
QuBAS allows the user to select whether the left asymptote should be A or D, or to try both.
When E = 1 the 5PL model becomes the 4PL model. When E is not 1 the 5PL is asymmetric.
Analysis options
The 5PL model offers all the common analysis options and the following specific one.
Sign of B
This option allows the user to decide whether they prefer to have the A and D parameters on the left and right of the graph respectively (default setting), or vice versa. It is possible to try both options, in which case QuBAS will select the orientation which gives the best fit to the data.
System Suitability Criteria
The 5PL model offers all the common system suitability criteria and the following specific ones.
Reference standard
Goodness of fit of the model
The goodness of fit for a 5PL is not defined when there is no pure error, as is the case with pseudo-replicates. This test will be effective in a future version of QuBAS, which will offer the choice between replicates and pseudo-replicates.
Parameter values
a) Ranges for parameter values  can be set.
b) Equivalence limits for can be set:
c) Ranges for the confidence intervals for (no default setting).
The confidence level for the each interval can be chosen by the user (no default setting).
•These tests are also available for the range (distance between the asymptotes).
Statistical significance of the slope,
a)
 , via a one-sample t test comparing the slope with zero.
•The level (critical P value) can be chosen by the user
Default is 0.05.
Combination of parameter values
a) Range and equivalence limits for:
-
Range (distance between the asymptotes)
-
Location of midpoint ( ):
): 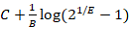
-
The amount of Asymmetry:  .
.
Sample Suitability Criteria
The 5PL model has the standard sample suitability criteria, see here.
Result (estimated concentration)
Concentration estimate
The model for the standard curve is:
The model for the test sample is then:
For details please contact Quantics.
