The model for the standard curve is:

The model for the test sample is then:
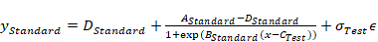
Where for the reference standard and the test sample respectively:
-

is the response at

dose

,
-
 and
and  are the asymptotes
 -
 is proportional to the slope at the mid-point.
 -
-
 is proportional to the slope at the midpoint.
 -
If  :
:
-
is the left asymptote
-
is the right asymptote
-
If  :
:
-
is the right asymptote
-
is the left asymptote
-
Analysis options
The 4PL model offers all the common analysis options and the following specific one.
a) is Positive The user can select the ‘orientation’ of the 4PL with this option.
System Suitability Criteria
The 4PL model offers all the common system suitability criteria and the following specific ones.
Reference standard
Goodness of fit of the model
a) A 5PL model can be fitted to the data and the significance of the quadratic term tested via a t test.
• The level (critical p value) can be chosen by the user.
• Default is 0.05.
Parameter values
a) Ranges for parameter values  can be set.
b) Equivalence limits for can be set:
-
Ranges for the confidence intervals for (no default setting).
-
The confidence level for the each interval can be chosen by the user (no default setting).
-
These tests are also available for the range (distance between the asymptotes).
Statistical significance of the slope,  , via a one-sample t test comparing the slope with zero.
•The level (critical P value) can be chosen by the user
Default is 0.05.
Sample Suitability Criteria
The 4PL model has the standard sample suitability criteria, see here.
Result (estimated concentration)
Concentration estimate
The model for the standard curve is:
The model for the test sample is then:
For details please contact Quantics.
