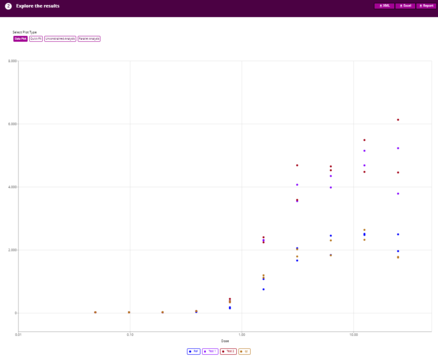
Simple data plots and basic statistics can be inspected on the Analysis Definitions page by selecting Data Plots under 'and the results':
The plots are interactive and can be hovered over to identify specific points. Clicking on the samples below the x axis can temporality exclude those points for better comparisons.
Quick Fit
To assume a quick estimation of the curve that would be assigned to the data plot, the quick fit function can be used.
*VIDEO*
The Quick Fit option when you run your analysis will carry out a quick analysis that takes a few seconds - this is shown by the pop up. Once complete, the pop up will close and the curves can be seen on the right under the Quick Fit plot type.